Comparative Study
. 2018 Jan 16;17(1):13.
doi: 10.1186/s12933-017-0645-0.

Comparison of speckle-tracking echocardiography with invasive hemodynamics for the detection of characteristic cardiac dysfunction in type-1 and type-2 diabetic rat models

Affiliations
Comparative Study

Comparison of speckle-tracking echocardiography with invasive hemodynamics for the detection of characteristic cardiac dysfunction in type-1 and type-2 diabetic rat models

Csaba Mátyás et al. Cardiovasc Diabetol. .

Abstract

Background: Measurement of systolic and diastolic function in animal models is challenging by conventional non-invasive methods. Therefore, we aimed at comparing speckle-tracking echocardiography (STE)-derived parameters to the indices of left ventricular (LV) pressure-volume (PV) analysis to detect cardiac dysfunction in rat models of type-1 (T1DM) and type-2 (T2DM) diabetes mellitus.

Methods: Rat models of T1DM (induced by 60 mg/kg streptozotocin, n = 8) and T2DM (32-week-old Zucker Diabetic Fatty rats, n = 7) and corresponding control animals (n = 5 and n = 8, respectively) were compared. Echocardiography and LV PV analysis were performed. LV short-axis recordings were used for STE analysis. Global circumferential strain, peak strain rate values in systole (SrS), isovolumic relaxation (SrIVR) and early diastole (SrE) were measured. LV contractility, active relaxation and stiffness were measured by PV analysis.

Results: In T1DM, contractility and active relaxation were deteriorated to a greater extent compared to T2DM. In contrast, diastolic stiffness was impaired in T2DM. Correspondingly, STE described more severe systolic dysfunction in T1DM. Among diastolic STE parameters, SrIVR was more decreased in T1DM, however, SrE was more reduced in T2DM. In T1DM, SrS correlated with contractility, SrIVR with active relaxation, while in T2DM SrE was related to cardiac stiffness, cardiomyocyte diameter and fibrosis.

Conclusions: Strain and strain rate parameters can be valuable and feasible measures to describe the dynamic changes in contractility, active relaxation and LV stiffness in animal models of T1DM and T2DM. STE corresponds to PV analysis and also correlates with markers of histological myocardial remodeling.

Keywords: Cardiac dysfunction; Diabetic cardiomyopathy; HFpEF; HFrEF; Heart failure; Invasive hemodynamics; Murine models; Speckle-tracking echocardiography.


Figures
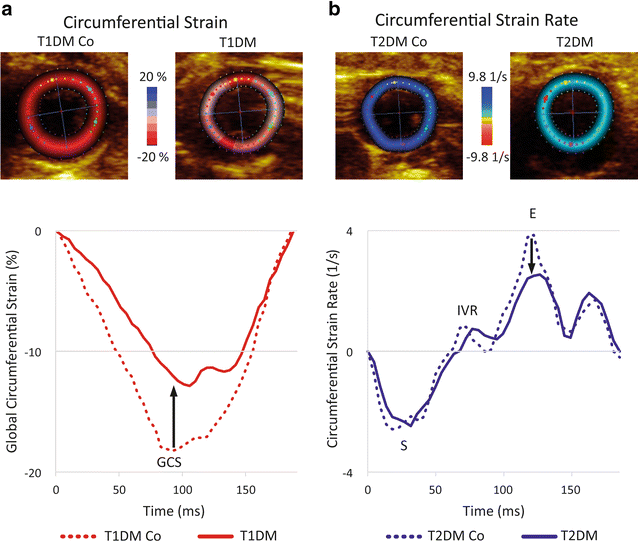
Fig. 1
Fig. 1
Layout of speckle-tracking analysis. a Determination of circumferential strain on short-axis recordings. The negative peak of the curve represents the global circumferential strain (GCS). b Determination of circumferential strain rate on short-axis images. The peak negative value is the global circumferential strain rate in systole (SrS). The following peak represents the value of isovolumic relaxation (SrIVR) while the positive peak value is the early diastolic strain rate (SrE). Groups: animals with T1DM, their non-diabetic controls (T1DM Co); animals with T2DM and their non-diabetic controls (T2DM Co). Arrows indicate the specific changes of strain and strain rate curves in DM
Fig. 2
Fig. 2
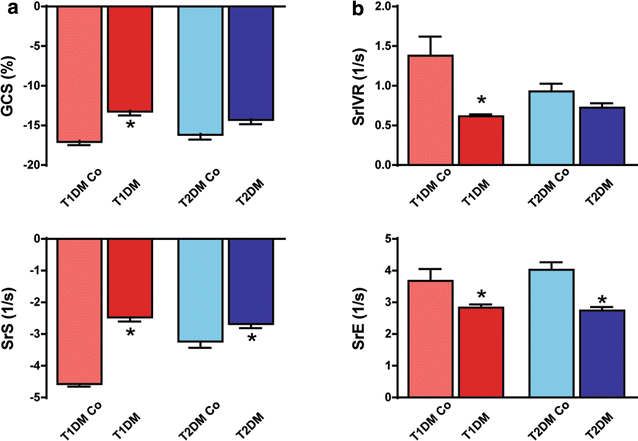
Results of speckle-tracking echocardiography. a Graphs show systolic parameters: global circumferential strain (GCS) and peak strain rate values in systole (SrS). b Graphs show diastolic parameters: peak strain rate at isovolumic relaxation (SrIVR) and in early diastole (SrE) in the groups. Groups: animals with T1DM, their non-diabetic controls (T1DM Co); animals with T2DM and their non-diabetic controls (T2DM Co). *p < 0.05 vs. corresponding controls
Fig. 3
Fig. 3
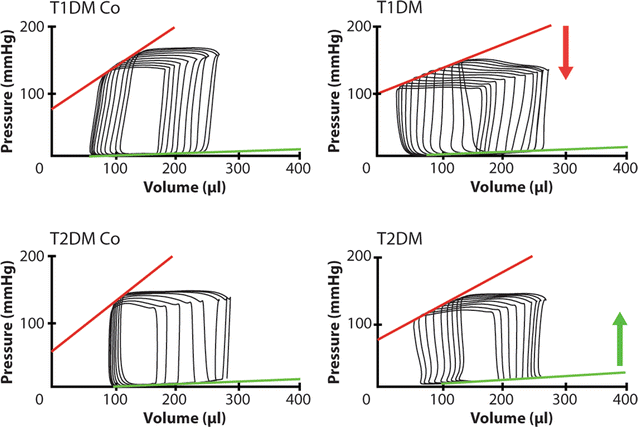
Representative pressure–volume loops. The figure shows representative left ventricular pressure–volume (PV) loops of the animals. Red line: end-systolic PV relationship; green line: end-diastolic PV relationship. Arrows indicate the change of PV relationships (red arrow: decrease in end-systolic PV relationship, green arrow: increase in end-diastolic PV relationship). Groups: animals with T1DM, their non-diabetic controls (T1DM Co); animals with T2DM and their non-diabetic controls (T2DM Co)
Fig. 4
Fig. 4
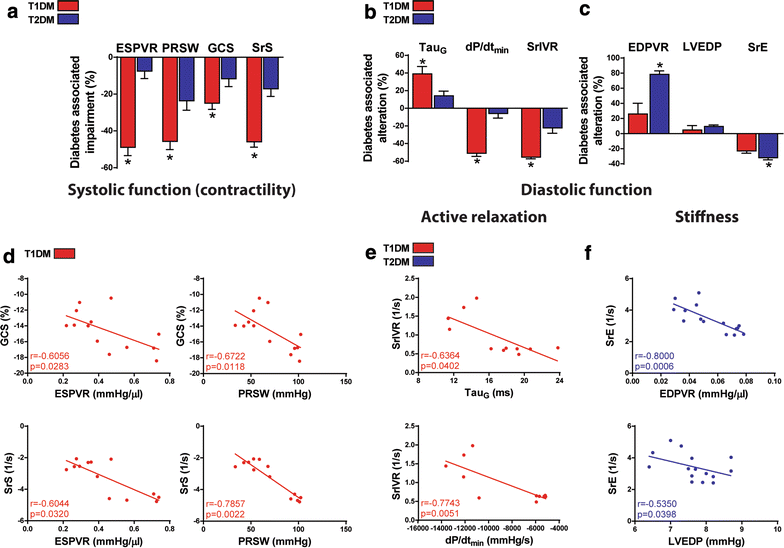
Diabetes associated impairment of systolic and diastolic function in diabetes. a Diabetes associated impairment of the following contractile parameters in type-1 and type-2 diabetes mellitus (T1DM, T2DM): end-systolic pressure–volume relationship (ESPVR), preload recruitable stroke work (PRSW), global circumferential strain (GCS) and the peak strain rate values in systole (SrS). b Diabetes associated alteration of diastolic parameters TauG, maximal slope of diastolic decrement (dP/dtmin) and strain rate at isovolumic relaxation (SrIVR) are shown. c Diabetes associated alteration of the slope of end-diastolic pressure–volume relationship (EDPVR), left ventricular end-diastolic pressure (LVEDP) and strain rate in early diastole (SrE) are shown. d Correlation analyses of GCS and SrS to ESPVR and PRSW are shown. e Correlation analyses of active relaxation parameter SrIVR to TauG and dP/dtmin are shown. f Correlation analyses of SrE to EDPVR and LVEDP are shown. Groups: animals with T1DM, their non-diabetic controls (T1DM Co); animals with T2DM and their non-diabetic controls (T2DM Co). *p < 0.05 T1DM vs. T2DM
Fig. 5
Fig. 5
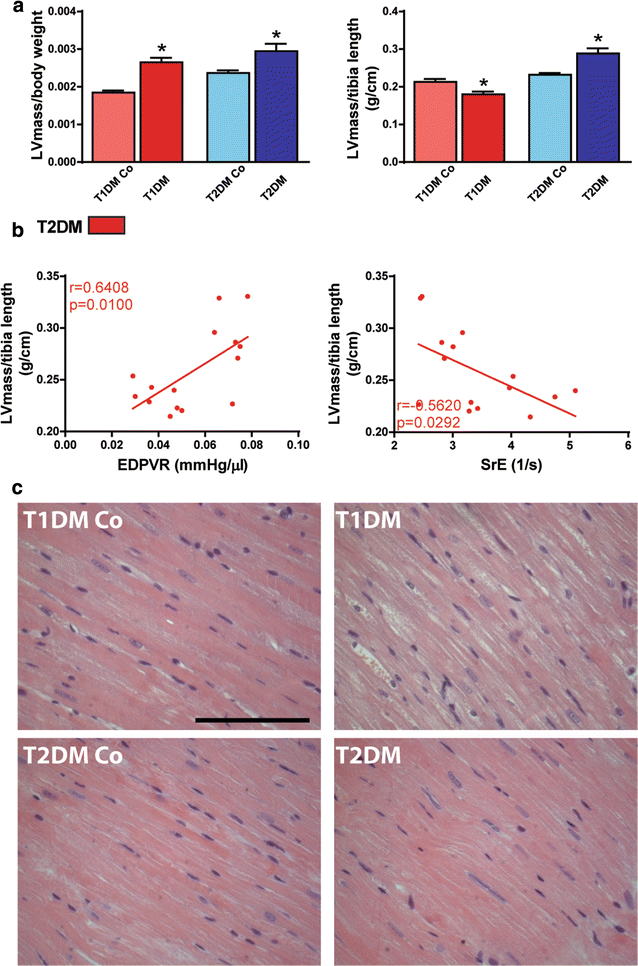
Cardiac stiffness correlates with the extent of myocardial hypertrophy. a Graphs of left ventricular (LV) mass to body weight (LVmass/body weight) and to tibia length (LVmass/tibia length) are shown. b Results of correlation analysis of LVmass/tibia length to the slope of end-diastolic pressure–volume relationship (EDPVR) and to early diastolic strain rate (SrE). c Representative hematoxylin–eosin stained sections. Magnification: ×400. Marker: 100 µm. *p < 0.05 vs. corresponding controls
Fig. 6
Fig. 6
Cardiac stiffness correlates with the extent of myocardial hypertrophy. a Analysis of cardiomyocyte diameter in the study groups. b Correlation analyses of cardiomyocyte diameter to EDPVR and SrE. Groups: animals with T1DM, their non-diabetic controls (T1DM Co); animals with T2DM and their non-diabetic controls (T2DM Co). *p < 0.05 vs. corresponding controls
Fig. 7
Fig. 7
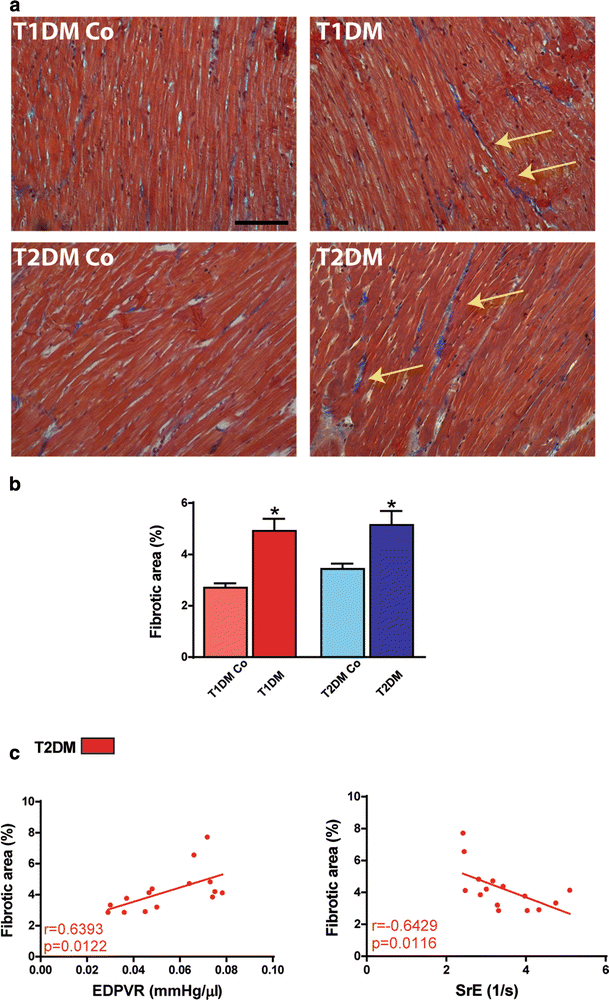
Cardiac stiffness correlates with myocardial fibrosis. a Masson’s trichrome stained images. Magnification: ×100. Marker: 100 µm. b Quantification of fibrotic area in the study groups. c Result of correlation analysis of EDPVR and SrE to fibrotic area. Groups: animals with T1DM, their non-diabetic controls (T1DM Co); animals with T2DM and their non-diabetic controls (T2DM Co). *p < 0.05 vs. corresponding controls

Similar articles

Cited by

References

    1. Chamberlain JJ, Rhinehart AS, Shaefer CF, Jr, Neuman A. Diagnosis and management of diabetes: synopsis of the 2016 American Diabetes Association standards of medical care in diabetes. Ann Intern Med. 2016;164:542–552. doi: 10.7326/M15-3016. - DOI - PubMed
    1. Shaw JE, Sicree RA, Zimmet PZ. Global estimates of the prevalence of diabetes for 2010 and 2030. Diabetes Res Clin Pract. 2010;87:4–14. doi: 10.1016/j.diabres.2009.10.007. - DOI - PubMed
    1. Huynh K, Bernardo BC, McMullen JR, Ritchie RH. Diabetic cardiomyopathy: mechanisms and new treatment strategies targeting antioxidant signaling pathways. Pharmacol Ther. 2014;142:375–415. doi: 10.1016/j.pharmthera.2014.01.003. - DOI - PubMed
    1. Miki T, Yuda S, Kouzu H, Miura T. Diabetic cardiomyopathy: pathophysiology and clinical features. Heart Fail Rev. 2013;18:149–166. doi: 10.1007/s10741-012-9313-3. - DOI - PMC - PubMed
    1. Rees DA, Alcolado JC. Animal models of diabetes mellitus. Diabet Med. 2005;22:359–370. doi: 10.1111/j.1464-5491.2005.01499.x. - DOI - PubMed

Publication types

MeSH terms