. 2018 Jul:191:xli-lviii.
doi: 10.1016/j.ajo.2017.12.019. Epub 2018 Jan 12.

Evolution of Intravitreal Therapy for Retinal Diseases-From CMV to CNV: The LXXIV Edward Jackson Memorial Lecture

Affiliations

Evolution of Intravitreal Therapy for Retinal Diseases-From CMV to CNV: The LXXIV Edward Jackson Memorial Lecture

Daniel F Martin. Am J Ophthalmol. 2018 Jul.

Abstract

Purpose: To present the evolution of intravitreal therapy for retinal diseases and its impact on clinical practice.

Design: Retrospective literature review and personal perspective.

Methods: Retrospective literature review and personal perspective.

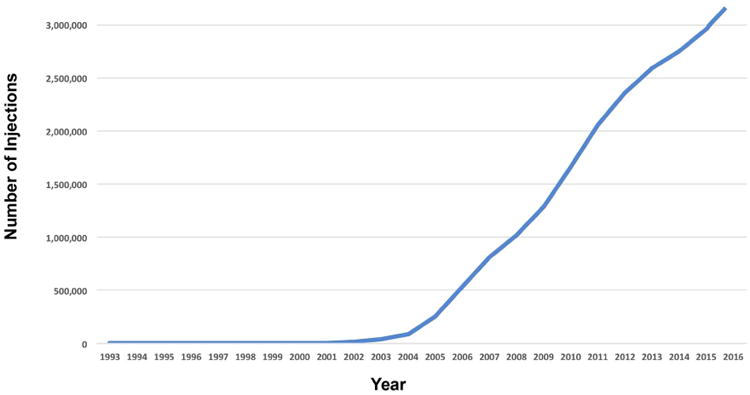
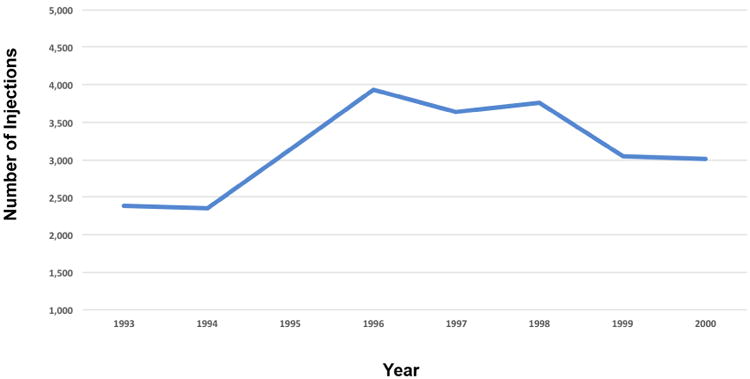
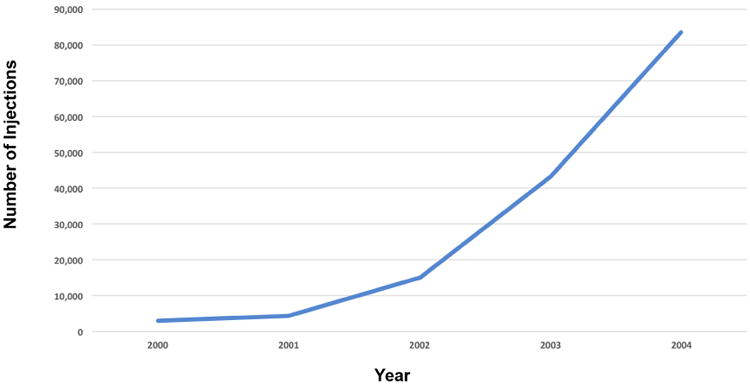
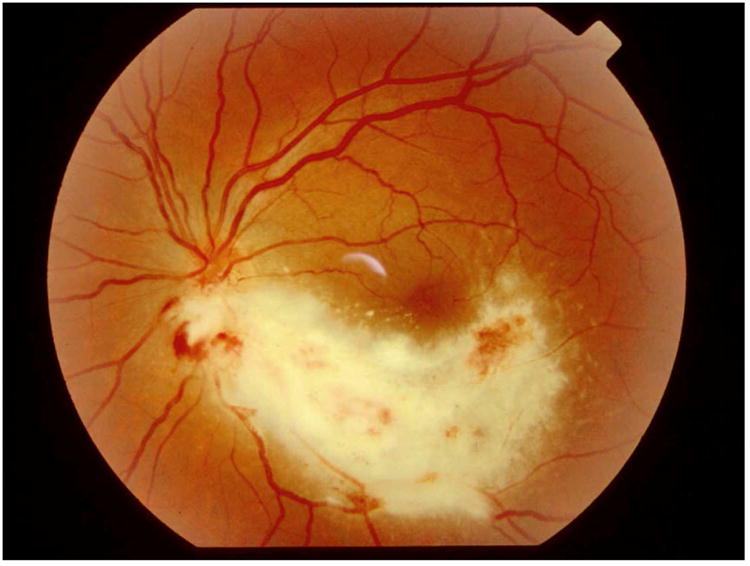
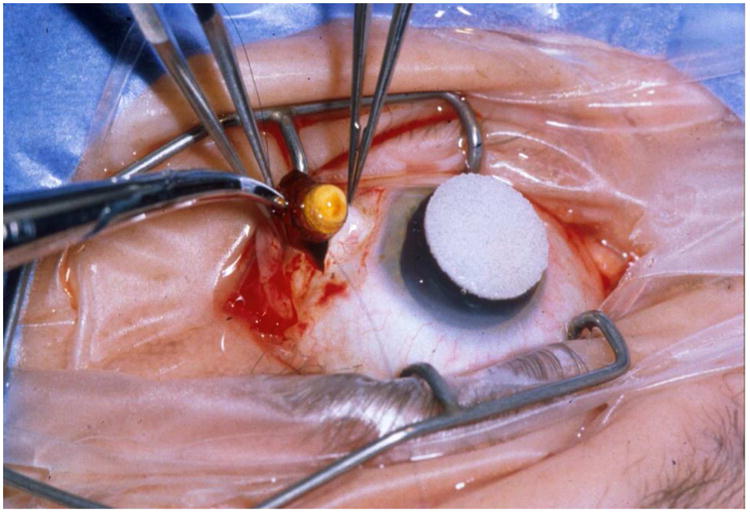
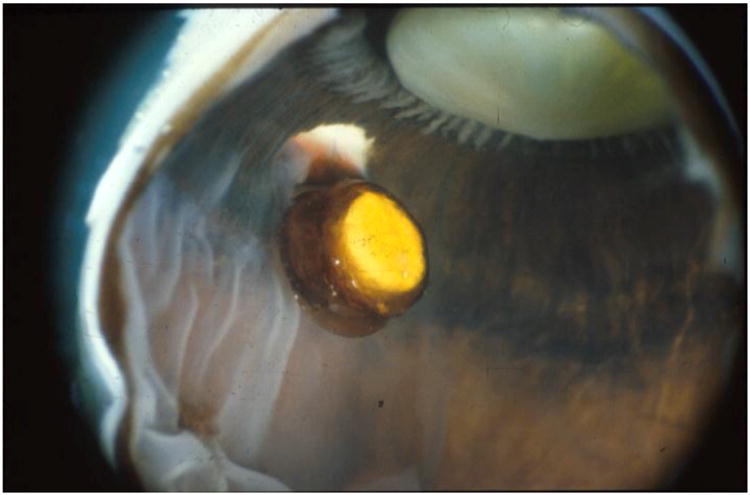
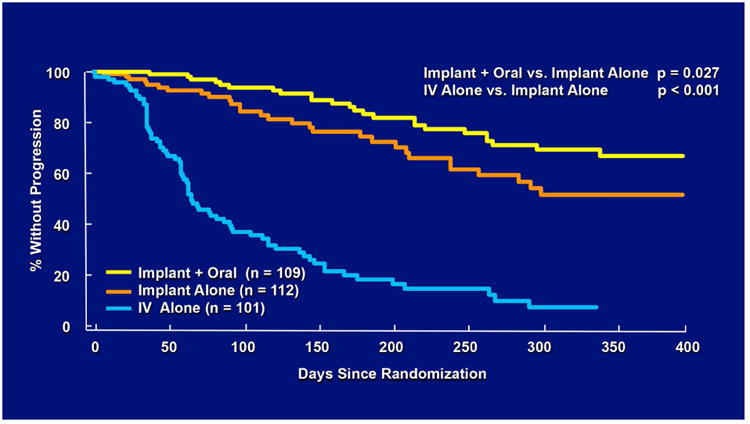
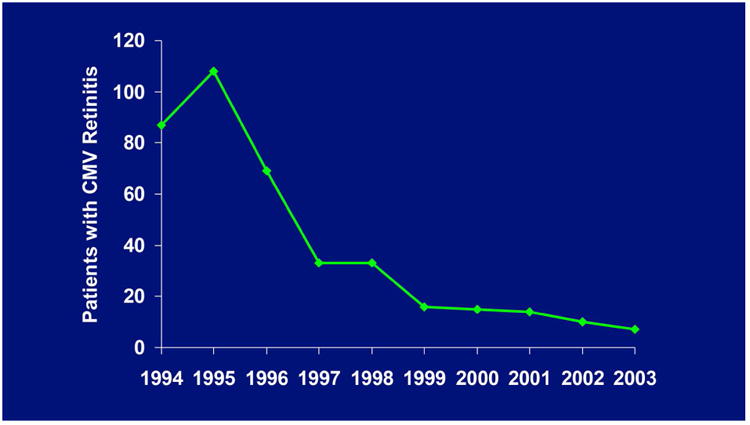
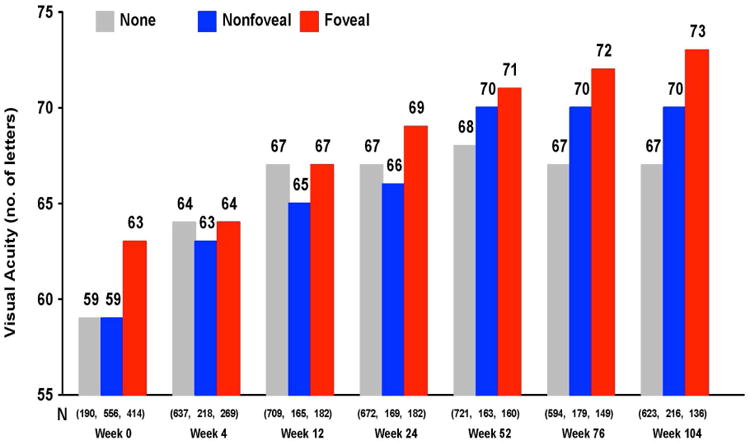
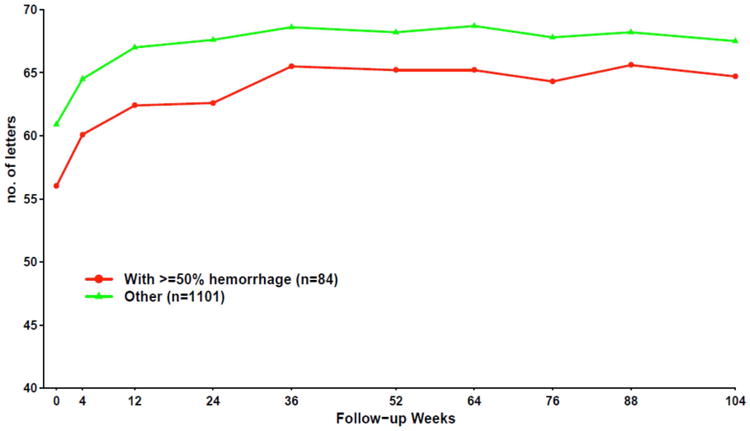
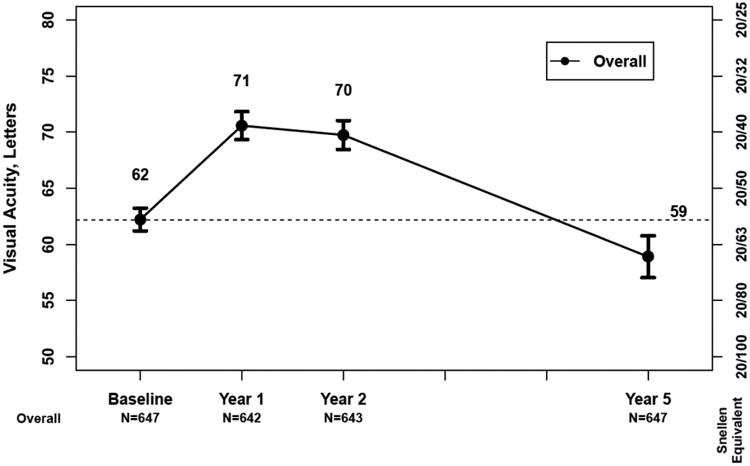
Results: Pharmacotherapeutic advances in retinal disease have been remarkable over the last 25 years. Almost all of the new drugs developed have required intravitreal administration to be highly effective, leading to an exponential increase in the annual number of intravitreal injections given. The use of intravitreal antibiotic injections to treat endophthalmitis, usually on a one-time basis, first familiarized ophthalmologists with this method of drug delivery. Ganciclovir was the first widely available, relatively inexpensive compounded drug that was used for repeat intravitreal injection to treat a chronic retinal disease, followed by triamcinolone for diabetic macular edema and bevacizumab for neovascular age-related macular degeneration. Ganciclovir was formulated for sustained-release drug delivery to avoid frequent intravitreal injections, a goal that has been more elusive for anti-VEGF drugs. Political obstacles encountered while conducting some of the trials to evaluate these treatments were substantial. Addressing the issues they raised led to important national policy changes that will impact the conduct of future clinical trials. The first comparative efficacy trial of intravitreal therapies was the Comparison of AMD Treatments Trials (CATT). The primary results from CATT and the many publications that followed continue to shape the use of intravitreal therapy today.

Conclusion: Intravitreal therapy has proven highly effective for the treatment of many retinal diseases. The treatment burden for patients from numerous injections, the cost to health care systems, and the impact on workflows in clinical practice have been substantial. Efforts to develop effective intravitreal therapies with reduced treatment burden and cost are ongoing.


Conflict of interest statement

Conflict of interests: None

Figures

Figure 1
Figure 1
(A) Number of intravitreal injection claims paid by fee-for-service Medicare between 1993 and 2016. (B) Increase and decline in intravitreal injections between 1994 and 2000, presumably due to the initial increase and subsequent decline in CMV retinitis during this time period. Patients with CMV patients were usually too young to qualify for Medicare unless they were disabled and some were. The absolute number of injections between 1994 and 2000 was much higher but the trend was still captured in this Medicare database. (C) Increase in number of injections beween 2000 and 2004 presumably due to the substantial increase in the use of intravitreal triamcinolone.
Figure 1
Figure 1
(A) Number of intravitreal injection claims paid by fee-for-service Medicare between 1993 and 2016. (B) Increase and decline in intravitreal injections between 1994 and 2000, presumably due to the initial increase and subsequent decline in CMV retinitis during this time period. Patients with CMV patients were usually too young to qualify for Medicare unless they were disabled and some were. The absolute number of injections between 1994 and 2000 was much higher but the trend was still captured in this Medicare database. (C) Increase in number of injections beween 2000 and 2004 presumably due to the substantial increase in the use of intravitreal triamcinolone.
Figure 2
Figure 2
A) Typical case of CMV retinitis. B) Surgical insertion of ganciclovir implant. C) Location of ganciclovir implant as seen in a post-mortem eye.
Figure 2
Figure 2
A) Typical case of CMV retinitis. B) Surgical insertion of ganciclovir implant. C) Location of ganciclovir implant as seen in a post-mortem eye.
Figure 2
Figure 2
A) Typical case of CMV retinitis. B) Surgical insertion of ganciclovir implant. C) Location of ganciclovir implant as seen in a post-mortem eye.
Figure 3
Figure 3
Kaplan-Meier curves showing the time to progression of cytomegalovirus (CMV) retinitis among eyes assigned to immediate treatment with a ganciclovir implant or deferred treatment, as determined by the Fundus Photograph Reading Center.
Figure 4
Figure 4
Kaplan-Meier curves showing the time to progression of cytomegalovirus (CMV) retinitis among eyes assigned to treatment with one of two doses of a ganciclovir implant or intravenous ganciclovir, as determined by the Fundus Photograph Reading Center.
Figure 5
Figure 5
Kaplan-Meier curves showing the time to progression of cytomegalovirus (CMV) retinitis among eyes assigned to treatment with a ganciclovir implant alone, ganciclovir implant and oral ganciclovir (4.5 gm/day) or intravenous ganciclovir, as determined by the Fundus Photograph Reading Center.
Figure 6
Figure 6
New cases of CMV retinitis referred to me between 1994 and 2001.
Figure 7
Figure 7
A&B) Color photo and fluorescein angiography of an active recurrent subfoveal CNV following previous laser photocoagulation. C) One month after intravitreal injection of NX1838. There was decreased leakage on fluorescein angiography, mild contraction of the CNV and no additional lesion growth. D) Three months after the injection, at a time when the drug would have been fully cleared from the eye based on its half-life, there was substantial lesion growth.
Figure 7
Figure 7
A&B) Color photo and fluorescein angiography of an active recurrent subfoveal CNV following previous laser photocoagulation. C) One month after intravitreal injection of NX1838. There was decreased leakage on fluorescein angiography, mild contraction of the CNV and no additional lesion growth. D) Three months after the injection, at a time when the drug would have been fully cleared from the eye based on its half-life, there was substantial lesion growth.
Figure 8
Figure 8
Mean change in visual acuity over time in patients treated with the same dosing regimen for 2 years in CATT.
Figure 9
Figure 9
Difference between bevacizumab and ranibizumab in mean visual acuity at one year in the CATT, IVAN, MANTA, GEFAL, BRAMD, and LUCAS trials.
Figure 10
Figure 10
Distribution of the number of injections given in the PRN arms of CATT during the first year of the study for patients treated with (A) ranibizumab or (B) bevacizumab. One in seven (14%) of patients in both groups needed only three or fewer injections to resolve all fluid during the first year of treatment as determined by the treating ophthalmologist.
Figure 10
Figure 10
Distribution of the number of injections given in the PRN arms of CATT during the first year of the study for patients treated with (A) ranibizumab or (B) bevacizumab. One in seven (14%) of patients in both groups needed only three or fewer injections to resolve all fluid during the first year of treatment as determined by the treating ophthalmologist.
Figure 11
Figure 11
Distribution of the number of injections given in the PRN arms of CATT over two years for patients treated with (A) ranibizumab or (B) bevacizumab.
Figure 11
Figure 11
Distribution of the number of injections given in the PRN arms of CATT over two years for patients treated with (A) ranibizumab or (B) bevacizumab.
Figure 12
Figure 12
Bar graph showing visual acuity results at 1 year by early VA response to treatment at 12 weeks in CATT.
Figure 13
Figure 13
Mean visual acuity by status of fluid over two years in CATT for (A) intraretinal fluid and (B) subretinal fluid.
Figure 13
Figure 13
Mean visual acuity by status of fluid over two years in CATT for (A) intraretinal fluid and (B) subretinal fluid.
Figure 14
Figure 14
Mean visual acuity over time by presence of ≥ 50% hemorrhage at baseline.
Figure 15
Figure 15
A) Bar graph showing the distribution of visual acuity over time for 647 patients in the CATT Follow-up Study. B) Mean visual acuity over time for patients in the CATT Follow-up Study
Figure 15
Figure 15
A) Bar graph showing the distribution of visual acuity over time for 647 patients in the CATT Follow-up Study. B) Mean visual acuity over time for patients in the CATT Follow-up Study

References

    1. Williams G. Intravitreal injections: health policy implications. Review of Ophthalmology. 2014;(June) https://www.reviewofophthalmology.com/article/ivt-injections-health-poli....
    1. RBRVS DataManager Online. Copyright American Medical Association
    1. Machemer R, Aaberg TM. Vitrectomy. New York: Grune & Stratton; 1979.
    1. Peyman GA, Herbst R. Bacterial endophthalmitis Treatment with intraocular injection of gentamicin and dexamethasone. Arch Ophthalmol. 1974;91:416–418. - PubMed
    1. May DR, Ericson ES, Peyman GA, Axelrod AJ. Intraocular injection of gentamicin. Single injection therapy of experimental bacterial endophthalmitis. Arch Ophthalmol. 1974;91:487–489. - PubMed

Publication types

MeSH terms

Substances