. 2018 Mar;6(3):276-287.
doi: 10.1158/2326-6066.CIR-17-0559. Epub 2018 Jan 16.

Tumor Immunity and Survival as a Function of Alternative Neopeptides in Human Cancer

Affiliations

Tumor Immunity and Survival as a Function of Alternative Neopeptides in Human Cancer

Andrew J Rech et al. Cancer Immunol Res. 2018 Mar.

Abstract

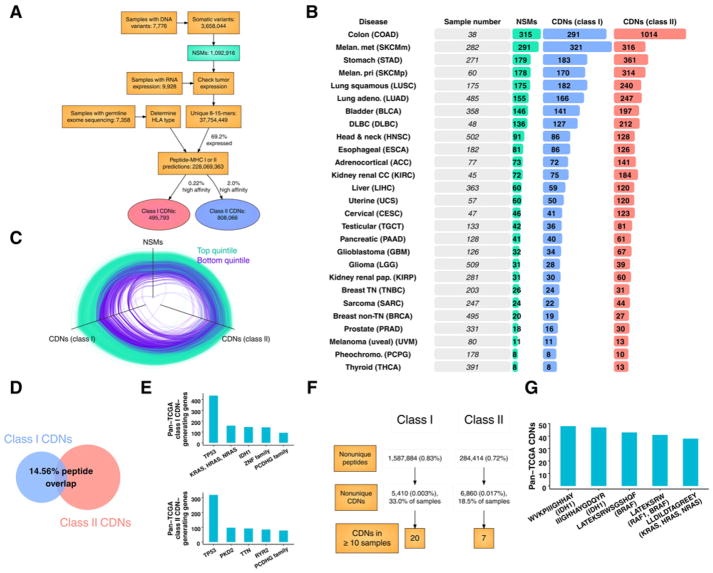
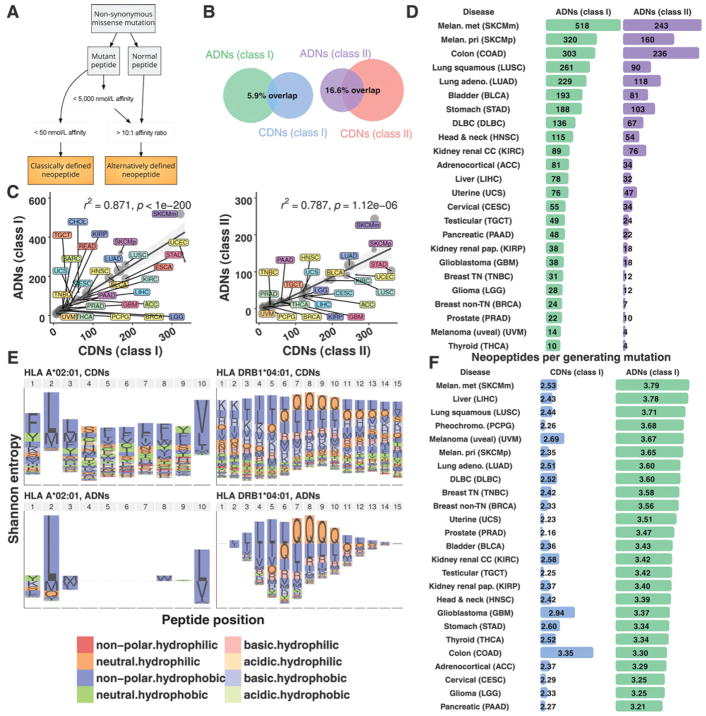
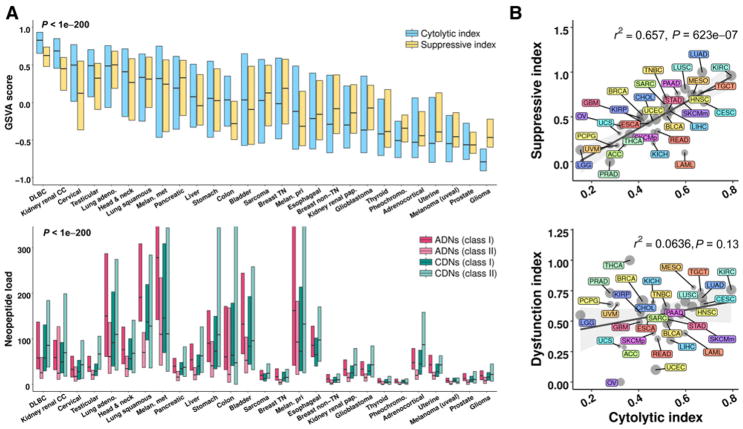
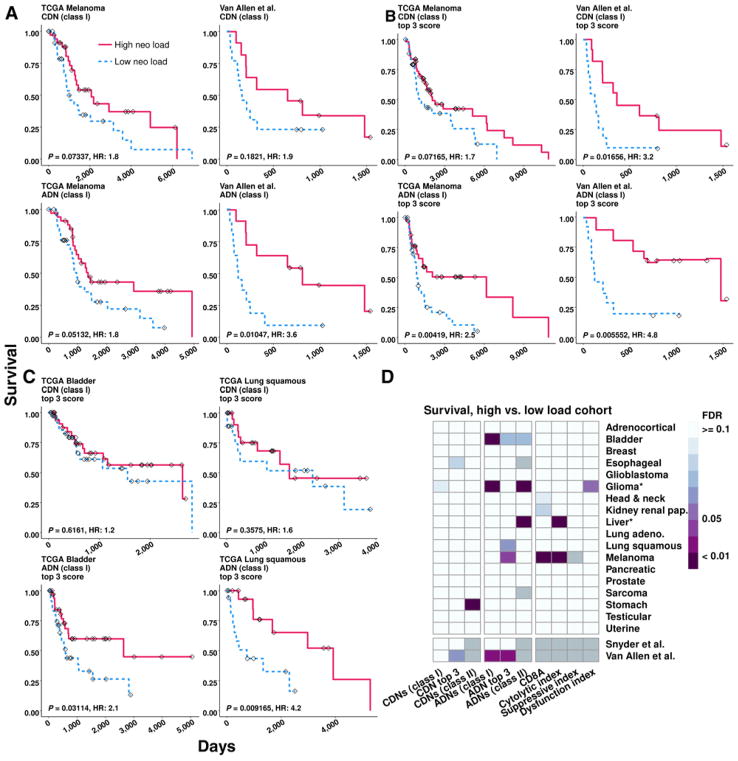
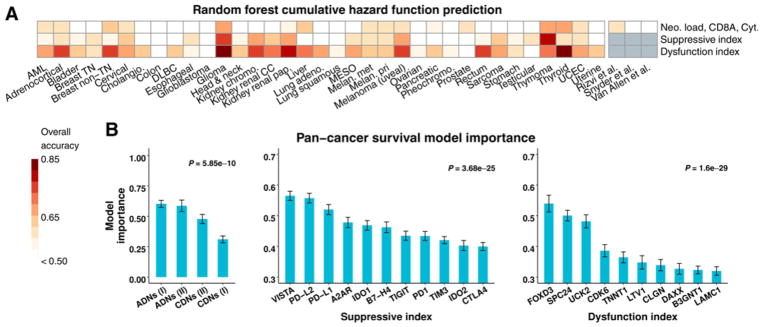
The immune system exerts antitumor activity via T cell-dependent recognition of tumor-specific antigens. Although the number of tumor neopeptides-peptides derived from somatic mutations-often correlates with immune activity and survival, most classically defined high-affinity neopeptides (CDNs) are not immunogenic, and only rare CDNs have been linked to tumor rejection. Thus, the rules of tumor antigen recognition remain incompletely understood. Here, we analyzed neopeptides, immune activity, and clinical outcome from 6,324 patients across 27 tumor types. We characterized a class of "alternatively defined neopeptides" (ADNs), which are mutant peptides predicted to bind MHC (class I or II) with improved affinity relative to their nonmutated counterpart. ADNs are abundant and molecularly distinct from CDNs. The load of ADNs correlated with intratumoral T-cell responses and immune suppression, and ADNs were also strong predictors of patient survival across tumor types. These results expand the spectrum of mutation-derived tumor antigens with potential clinical relevance. Cancer Immunol Res; 6(3); 276-87. ©2018 AACR.


Conflict of interest statement

Disclosure of Potential Conflicts of Interest

No potential conflicts of interest were disclosed.

Figures

Figure 1
Figure 1
CDNs across human cancer. A, Pipeline of data types and numbers (see Supplementary Fig. S1 for a detailed pipeline). B, Summary of NSMs, predicted class I (<50 nmol/L IC50) and II (<1% rank) CDNs. Tumor types are ordered from top to bottom by mean number of NSMs. Cohort sizes are shown for MHC class I predictions. C, Parallel coordinate plot showing frequency of NSMs and MHC class I and II CDNs across all tumor types. Edges are samples in the top (green) or bottom (purple) quintile by MHC class I CDN load. Each vertex is normalized from 0 to 1. D, Venn diagram of mean percent MHC class I CDNs (left) contained in class II CDNs (right). Overlapping class I neopeptides are those whose peptide sequence is contained in a class II CDN from the same sample. E, Most frequent pan-TCGA common CDN-generating genes. Y-axis: total number of neopeptides derived from the indicated gene for MHC class I (top) and II (bottom). F, Shared MHC class I and II CDNs across all samples. Percentages: total peptides. Neopeptides were considered duplicates across samples if the same peptide sequence met CDN criteria for sample-specific HLA. G, Most frequent pan-TCGA neopeptides.
Figure 2
Figure 2
ADNs are largely distinct from CDNs. A, CDNs were identified based solely on high mutant peptide MHC-binding affinity. ADNs were identified based on ≥10-fold improvement in MHC-binding affinity of mutant peptide vs. nonmutant counterparts, quantified as DAI. B, Venn diagrams of overlap between class I (left) and II (right) neopeptide categories. Denominator for percent overlap: total number of ADNs + CDNs. C, Predicted MHC class I (left) and II (right) ADNs and CDNs. R2 values: linear regression; P values: Spearman rho. Dot size: sample number. Shaded gray region: confidence interval. D, Summary of ADNs. Tumor types are ordered from top to bottom by mean number of predicted MHC class I ADNs. E, Shannon entropy index of mutated amino acids by peptide position for the MHC class I and II alleles for CDNs (top) and ADNs (bottom). Two HLA alleles are shown: HLA A*02:01 and DRB1*04:01. F, Summary of generator rate by neopeptide category and tumor type (see Supplementary Fig. S3 for common ADN-generating genes and shared ADNs).
Figure 3
Figure 3
Immune activity and neopeptide load correlate across tumor types. A, Cytolytic index and suppressive index across tumor types (top) and corresponding neopeptide load for the four indicated categories (bottom). Cytolytic index: expressed as the GSVA score of normalized GZMA and PRF1 expression (40, 41). Suppressive index: the GSVA score of normalized expression for ADORA2A (A2AR), CD274 (PD-L1), PDCD1 (PD1), CTLA4, HAVCR2 (TIM3), IDO1, IDO2, PDCD1LG2 (PD-L2), TIGIT, VISTA (C10orf54), and VTCN1 (B7-H4). Box and line, the 75th to 25th percentiles and median, respectively. Tumor types are ordered from left to right by median cytolytic index. P value: ANOVA across tumor types. B, Cytolytic index (x-axis) and suppressive index (top y-axis) or dysfunction index (bottom y-axis). Dysfunction index: GSVA score of tumor dysfunction genes identified by (37). R2 values: linear regression. P values: Spearman rho. Dot size, sample number. Shaded gray region, confidence interval.
Figure 4
Figure 4
ADN load is associated with survival. A–C, Kaplan–Meier curves for the indicated neopeptide category and tumor type showing survival difference between samples with high (red) vs. low (blue) neopeptide load, defined as the top and bottom deciles. Tick marks, time of last known survival status. P value is unadjusted log rank. D, Summary of log-rank FDR values. Comparison is between high vs. low neopeptide load samples. Asterisk, improved survival in the low-neopeptide load cohort; gray box: data not available. Tumor types with <50 samples with neopeptide predictions were excluded. Number of observations for each tumor is listed in Supplementary Table S1.
Figure 5
Figure 5
ADNs are strong predictors of survival. A, Overall cumulative hazard function random forest model prediction accuracy for each TCGA tumor type. Model input variables were ADN and CDN load, CD8A expression, and cytolytic index (top), suppressive index genes (middle) or dysfunction index genes (bottom). An accuracy of 0.5 is equivalent to random guessing. B, Pan-cancer survival model importance. X-axis: model input variables from predictive models, ordered from left to right by importance. P values determined by ANOVA. Error bars, SEM in cross-validation replicates. Only top variables for the dysfunction index are shown.

References

    1. Schumacher TN, Schreiber RD. Neoantigens in cancer immunotherapy. Science. 2015;348:69–74. - PubMed
    1. Giannakis M, Mu XJ, Shukla SA, Qian ZR, Cohen O, Nishihara R, et al. Genomic correlates of immune-cell infiltrates in colorectal carcinoma. Cell Rep. 2016;15:857–65. - PMC - PubMed
    1. Van Allen EM, Miao D, Schilling B, Shukla SA, Blank C, Zimmer L, et al. Genomic correlates of response to CTLA-4 blockade in metastatic melanoma. Science. 2015;350:207–11. - PMC - PubMed
    1. Rizvi NA, Hellmann MD, Snyder A, Kvistborg P, Makarov V, Havel JJ, et al. Mutational landscape determines sensitivity to PD-1 blockade in non-small cell lung cancer. Science. 2015;348:124–8. - PMC - PubMed
    1. Le DT, Uram JN, Wang H, Bartlett BR, Kemberling H, Eyring AD, et al. PD-1 blockade in tumors with mismatch-repair deficiency. N Engl J Med. 2015;372:2509–20. - PMC - PubMed

Publication types

MeSH terms

Substances