. 2018 Feb 5;215(2):459-479.
doi: 10.1084/jem.20171739. Epub 2018 Jan 16.

Ontogeny of human mucosal-associated invariant T cells and related T cell subsets

Affiliations

Ontogeny of human mucosal-associated invariant T cells and related T cell subsets

Ghada Ben Youssef et al. J Exp Med. .

Abstract

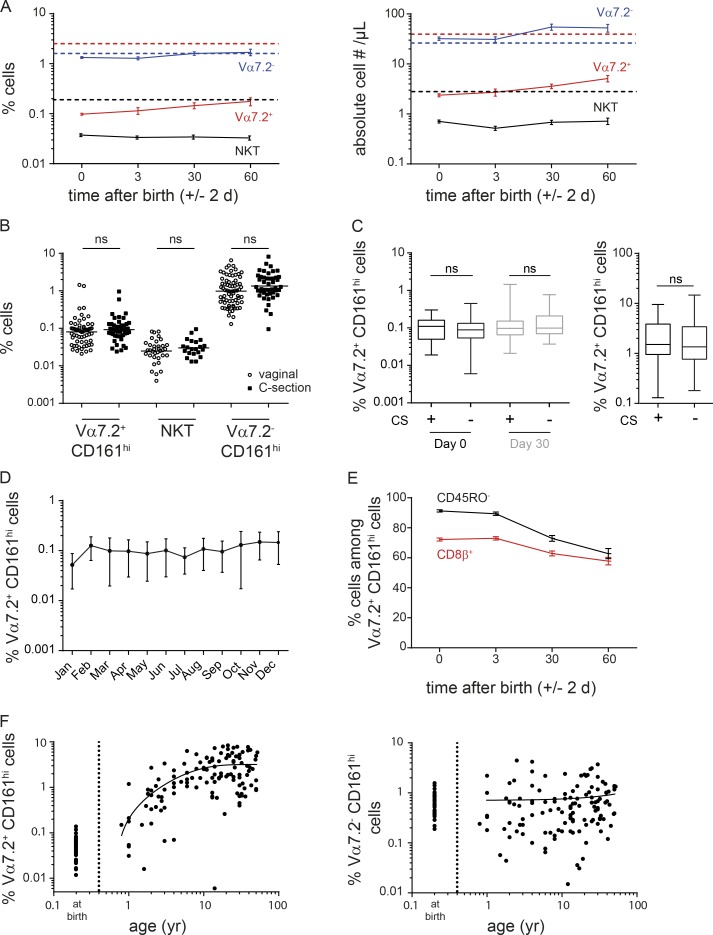
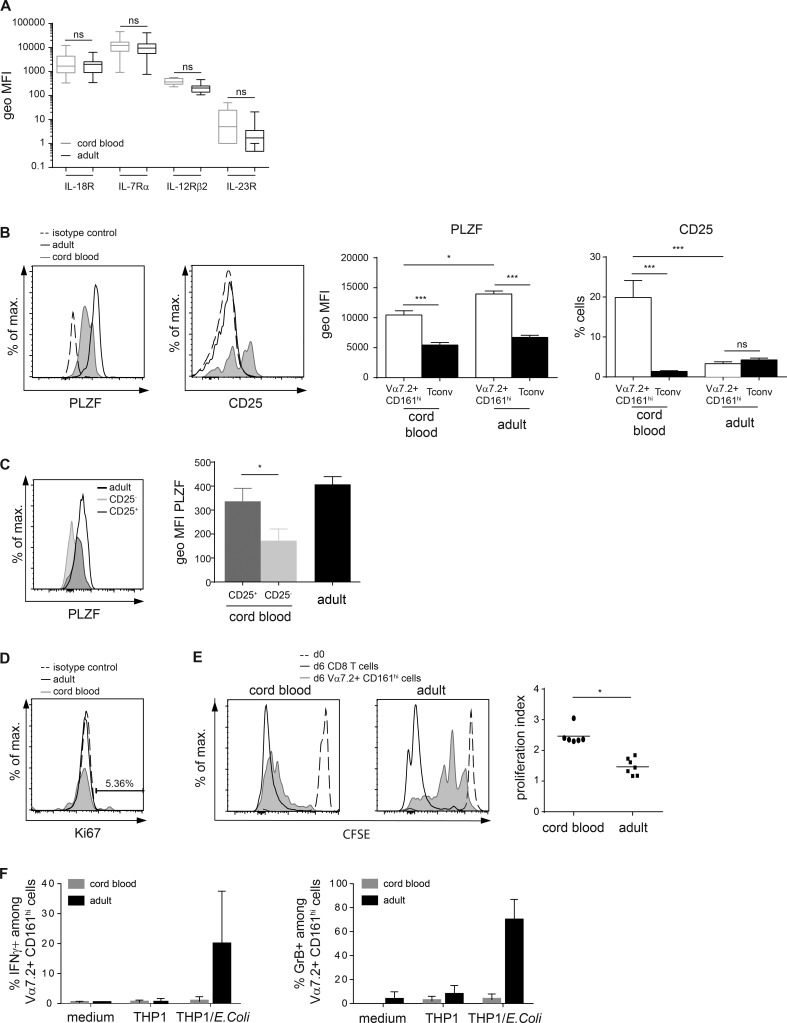
Mucosal-associated invariant T (MAIT) cells are semi-invariant Vα7.2+ CD161highCD4- T cells that recognize microbial riboflavin precursor derivatives such as 5-OP-RU presented by MR1. Human MAIT cells are abundant in adult blood, but there are very few in cord blood. We longitudinally studied Vα7.2+ CD161high T cell and related subset levels in infancy and after cord blood transplantation. We show that Vα7.2+ and Vα7.2- CD161high T cells are generated early during gestation and likely share a common prenatal developmental program. Among cord blood Vα7.2+ CD161high T cells, the minority recognizing MR1:5-OP-RU display a TRAV/TRBV repertoire very similar to adult MAIT cells. Within a few weeks of life, only the MR1:5-OP-RU reactive Vα7.2+ CD161high T cells acquire a memory phenotype. Only these cells expand to form the adult MAIT pool, diluting out other Vα7.2+ CD161high and Vα7.2- CD161high populations, in a process requiring at least 6 years to reach adult levels. Thus, the high clonal size of adult MAIT cells is antigen-driven and likely due to the fine specificity of the TCRαβ chains recognizing MR1-restricted microbial antigens.


Figures

Figure 1.
Figure 1.
Vα7.2+ CD161high T cell frequencies in neonates. (A) Quantification of the Vα7.2-Jα33 rearrangement (TRAV1-2 TRAJ33) by qPCR. Vα7.2-Jα33 expression was normalized to Cα expression in FACS-sorted Vα7.2+ CD161high and Vα7.2+ CD161 cells from three cord blood and two adult blood samples. The median from adult blood Vα7.2+ CD161high populations was arbitrarily set to 100%. (B) Quantification of the canonical MAIT TCRα reads (TRAV1-2 TRAJ33/20/12 and 12–amino acid–long CDR3; left) and GEM TCRα reads (TRAV1-2 TRAJ9 and 13–amino acid–long CDR3; right) in sorted Vα7.2+ CD161high and Vα7.2+ CD161 populations from three cord blood and three adult blood samples. (C) Representative Vα7.2+ CD161high cell staining in a neonate and a healthy adult control. Numbers indicate the percentage of Vα7.2+ and Vα7.2 CD161high cells among the CD3+ CD4 γδ T cell gate. (D) Statistical dot plots showing the percentage of Vα7.2+ CD161high cells among CD3+ T lymphocytes in 153 neonates and 36 healthy adult controls. Geometric means (horizontal bars) and statistical significance (Mann–Whitney test) are indicated. (E) Individual values and geometric means (horizontal bars) of frequencies of Vα7.2+ CD161high, Vα7.2 CD161high, NKT, and conventional CD4 and CD8 T cells in each group of neonates (GA 24–27 wk, n = 28; GA 28–31 wk, n = 48; GA 32–36 wk, n = 41; >37 wk, n = 36). Differences between means were analyzed by one-way ANOVA with posttest for linear trend. (F) Correlation between the frequencies of Vα7.2+ CD161high cells in 115 neonates and their mothers at birth. (G) Correlation between the frequencies of Vα7.2+ CD161high, Vα7.2 CD161high, and NKT cells in 153 neonates at birth. The percentage of cells was transformed by using log to base 10 to perform statistical analysis. Spearman rank correlation coefficients (r) are indicated. (H) Correlation of the frequencies of Vα7.2+ CD161high cells (left), Vα7.2 CD161high cells (medium), and NKT cells (right) between 21 twin pairs at birth (4 monozygotic and 17 dizygotic pairs, indicated by asterisks and circles, respectively). *, P < 0.01; **, P < 0.001; ***, P < 0.0001.
Figure 2.
Figure 2.
Kinetics of Vα7.2+ CD161high T cell expansion and maturation after birth. (A) Comparison of Vα7.2+ CD161high, Vα7.2 CD161high, and NKT cell expansion after birth in the whole neonate cohort. Results show the mean ± SEM of frequencies (left) and absolute numbers (right) in the indicated populations during the first 2 mo of life. Note that a varying number of subjects was analyzed at the different time points (n = 286 at day 0, n = 186 at day 3, n = 118 at day 30, and n = 49 at day 60) because of drop out (most subjects from groups 3 and 4 were discharged at day 30). Dashed lines represent the mean values in the corresponding population as measured for healthy adults. (B) Absence of relationship between percentages of Vα7.2+ CD161high, NKT, and Vα7.2 CD161high cells at 1 mo of life and delivery type (vaginal or C-section). Differences between means were analyzed by using the Mann–Whitney unpaired test. (C) Effect of antenatal CS therapy on Vα7.2+ CD161high T cell frequencies in neonates analyzed at birth and 1 mo of age (left) and in their mothers on the day of delivery (right). Results are depicted as box and whisker plots in the presence (+CS) or absence (-CS) of antenatal CS therapy (two 12-mg intramuscular doses of betamethasone 24 h apart at least 48 h before delivery). (D) Absence of variation in neonatal Vα7.2+ CD161high T cell frequencies (mean ± SEM) by month of birth. (E) Parallel changes in the CD45RO and CD8β Vα7.2+ CD161high cell phenotype over the first 2 mo of life in the whole neonate cohort. Results show the mean frequencies ± SEM of CD45RO and CD8β+ cells at the different time points. (F) Relationship between log10-based transformed Vα7.2+ CD161high cell percentages and age. Results show individual values of Vα7.2+ CD161high and Vα7.2 CD161high cell frequencies in 79 healthy children aged 10 mo to 17 yr and 50 healthy adults aged 18–50 yr. Values in 36 healthy term neonates are shown for comparison.
Figure 3.
Figure 3.
Vα7.2+ CD161high T cell recovery and maturation after unrelated cord blood transplantation in children. (A) Recovery dynamics of Vα7.2+ CD161high, Vα7.2 CD161high, and conventional T and B cells during the first 12 mo after UCB transplantation (n = 17 children). Data are depicted as the mean absolute values ± SEM. Dashed lines represent the mean values in the corresponding population as measured for healthy, age-matched children (n = 75). (B) Parallel changes in the CD45RO and CD8β Vα7.2+ CD161high cell phenotype during the first 12 mo after UCB transplantation. Results show the mean frequencies ± SEM of CD45RO and CD8β+ cells at the different time points. The rebound in CD45RO MAIT numbers around 9 mo after HSCT (P = 0.06 compared with values at 6 mo) coincides with the emergence of newly thymus-derived naive cells. (C) Recovery dynamics of Vα7.2+ CD161high T cells according to the presence or absence of aGVHD (left) or severe microbial infection (right). (D) Immunohistochemical staining of intestinal tissue sections from normal small intestine samples showing the presence of CD8+ (panels a and c) and Vα7.2+ (panels b and d–f) cells. Staining is detected with AP- (panels a–d) or HRP (panels e and f)-antibody conjugate. Bars, 50 µm. (E) Immunohistochemical staining of intestinal biopsies taken for diagnostic purpose of aGVHD (panels a–d) or CMV infection (panels e and f) in HSCT children recipients, showing the presence of CD3+ (panel a) and CD8+ (panels c and e) cells but the absence of Vα7.2+ (panels b, d, and f) cells. Staining is detected with HRP-antibody conjugate. Bars, 50 µm. (F) Relationship between Vα7.2+ CD161high cell percentages (left) or absolute numbers (right) and time from transplantation in 36 cord blood transplant children recipients. Dashed lines represent the 95% confidence interval as measured for healthy, age-matched controls.
Figure 4.
Figure 4.
Relationships between Vα7.2+ CD161high T cells and early-onset infection in neonates. (A) Individual values and means (horizontal bars) of Vα7.2+ CD161high T cell frequencies (left) and absolute numbers (right) at birth in extremely preterm neonates with (+) and without (−) early-onset infection. Differences between means were analyzed by using Mann–Whitney unpaired test. (B) Relationship between log10-based transformed Vα7.2+ CD161high cell percentages at birth and gestational age over the 24- to 42-wk span in the absence (left) or presence (right) of early-onset infection. Spearman rank correlation coefficients (r) and P values are indicated. (C) Kinetics of Vα7.2+ CD161high cell expansion during the first 2 mo of life in neonates with and without early-onset infection. Results show the mean percentage ± SEM of Vα7.2+ CD161high cells over time and P value (two-way ANOVA). A varying number of subjects was analyzed at the different time points (n = 285 at day 0, n = 285 at day 3, n = 118 at day 30, and n = 49 at day 60) because of drop out. (D) Frequencies of Vα7.2+ CD161high (left) and Vα7.2 CD161high (right) cells among CD3 T cells isolated from surgically resected normal intestine (n = 8), necrotizing enterocolitis (n = 3), and appendix (n = 5) samples. (E) Representative histograms of CD45RO and CD69 expression in Vα7.2+ CD161high cells (shaded gray), Vα7.2 CD161high cells (dotted line), and conventional T cells (black line) isolated from a normal intestinal sample in a 2-mo-old child. *, P < 0.01; ***, P < 0.0001.
Figure 5.
Figure 5.
Phenotype and functional characteristics of neonatal Vα7.2+ CD161high T cells. Lymphocytes were isolated from 6–10 cord blood samples from full-term healthy neonates and the same number of healthy adult donors. (A) Expression levels of the indicated cytokine receptors. Box and whisker plot shows median, interquartile range, and the 10th and the 90th percentiles of geometric mean fluorescence intensity (MFI; Mann-Whitney test). (B) Left: Representative histograms of PLZF and CD25 expression by cord blood and adult blood Vα7.2+ CD161high T cells. Right: Mean values ± SEM of PLZF and CD25 expression by Vα7.2+ CD161high cells and conventional T cells from cord blood and adult blood (Mann–Whitney test). (C) Left: Representative histogram of PLZF expression in CD25+ and CD25 cord blood Vα7.2+ CD161high T cells and adult blood cells. Right: Mean values ± SEM of PLZF expression by CD25+ and CD25 Vα7.2+ CD161high cord blood cells (paired t test) and adult blood Vα7.2+ CD161high cells. Data were not acquired on the same flow cytometer as those in B, so MFI values cannot be compared. (D) Representative Ki67 intracellular staining in freshly isolated Vα7.2+ CD161high cells from cord blood (shaded gray) and adult blood (black) samples. The percentage of cycling Vα7.2+ CD161high cells, estimated by the fraction of Ki67+ cells, in the cord blood sample is indicated. (E) Vα7.2+ CD161high cell proliferating capacity. Left: Representative CFSE staining gated on Vα7.2+ CD161high T cells (shaded gray) and conventional CD8 T cells (black line) from cord blood and adult blood after 6-d culture with PHA. Dashed histogram shows the basal CFSE staining at day 0. Right: Individual values and means (horizontal bars) of proliferation index in response to PHA in cord blood and adult blood Vα7.2+ CD161high cells. P-value (Mann–Whitney test) is indicated. (F) Vα7.2+ CD161high T cell responses to microbial MR1 ligands. Freshly isolated CD4-negative T cells were cultured overnight in the presence or absence of THP-1/E. coli or THP-1 alone as negative control, at a 1:1 THP1/CD8 T cell ratio. Intracellular accumulation of IFNγ (left) and GrB (right) in Vα7.2+ CD161high cells from cord blood or healthy adult control was evaluated by flow cytometry. *, P < 0.01; ***, P < 0.0001.
Figure 6.
Figure 6.
Postnatal expansion of Vα7.2+ CD161high MR1:5-OP-RU tetramerpos and tetramerneg cells. (A) Identification of MR1:5-OP-RU reactive cells. Left: Dot plots showing the percentages of MR1:5-OP-RU tetramerpos cells among CD3+ CD4 Vα7.2+ CD161high cells in nine cord blood and four healthy adult blood samples. Right: Representative staining with MR1:6-FP tetramer (negative control, left quadrants) or MR1:5-OP-RU tetramer (right quadrants) in a cord blood and a healthy adult control. Numbers indicate the percentage of tetramerpos cells among the CD3+ CD4 Vα7.2+ CD161high T cell gate. (B) Percentage of canonical MAIT TCRα chain (as in Fig. 1 B) reads among FACS-sorted MR1:5-OP-RU tetramerpos, tetramerneg, or total CD3+ CD4 Vα7.2+ CD161high cells from cord blood and a healthy adult and Vα7.2+ CD161 from cord blood (negative control). (C) The proportion of MR1:5-OP-RU tetramerpos cells among CD3+ CD4 Vα7.2+ CD161high cells rapidly increases with age. Results show individual values in 79 healthy children aged 1 to 360 d. (D) Maturation (CD45RO and CD8β) and activation (CD69) phenotype of MR1:5-OP-RU tetramerpos (red dots) and tetramerneg (blue dots) cells among CD3+ CD4 Vα7.2+ CD161high cells in relation with age.
Figure 7.
Figure 7.
TCRβ repertoire analysis of cord blood and adult blood MAIT cells. (A) The analysis was performed by 5′RACE-PCR of sorted T cell subsets. Examples of rarefaction curves from the indicated subsets in cord blood (left) and adult (right) samples. The cumulative frequency of productive TCRβ rearrangement is plotted for individual clonotypes ranked according to decreasing frequency. In adult blood, only memory (CD45RO+) subsets were studied to allow a fair comparison. (B) Comparison of the TRBV and TRBJ fragments usage in sorted CD3+ CD4 Vα7.2+ CD161high cells from 4 cord blood (blue) and 14 adult blood (red) samples. Only the Vβ (left) and Jβ (right) genes in which differential expression between neonates and adult samples was found are plotted. The whole dataset is plotted in Fig. S3. (C) Comparison of the TRBV (left) and TRBJ (right) gene usage (same segments as in B) in sorted Vα7.2+ CD161high MR1:5-OP-RU tetramerpos and tetramerneg cells from four cord blood samples. The analysis was performed by multiplex PCR followed by high-throughput sequencing.

References

    1. Abrahamsson S.V., Angelini D.F., Dubinsky A.N., Morel E., Oh U., Jones J.L., Carassiti D., Reynolds R., Salvetti M., Calabresi P.A., et al. . 2013. Non-myeloablative autologous haematopoietic stem cell transplantation expands regulatory cells and depletes IL-17 producing mucosal-associated invariant T cells in multiple sclerosis. Brain. 136:2888–2903. 10.1093/brain/awt182 - DOI - PMC - PubMed
    1. Adkins B., Leclerc C., and Marshall-Clarke S.. 2004. Neonatal adaptive immunity comes of age. Nat. Rev. Immunol. 4:553–564. 10.1038/nri1394 - DOI - PubMed
    1. Billerbeck E., Kang Y.H., Walker L., Lockstone H., Grafmueller S., Fleming V., Flint J., Willberg C.B., Bengsch B., Seigel B., et al. . 2010. Analysis of CD161 expression on human CD8+ T cells defines a distinct functional subset with tissue-homing properties. Proc. Natl. Acad. Sci. USA. 107:3006–3011. 10.1073/pnas.0914839107 - DOI - PMC - PubMed
    1. Booth J.S., Salerno-Goncalves R., Blanchard T.G., Patil S.A., Kader H.A., Safta A.M., Morningstar L.M., Czinn S.J., Greenwald B.D., and Sztein M.B.. 2015. Mucosal-associated invariant T cells in the human gastric mucosa and blood: Role in helicobacter pylori infection. Front. Immunol. 6:466 10.3389/fimmu.2015.00466 - DOI - PMC - PubMed
    1. Chen Z., Wang H., D’Souza C., Sun S., Kostenko L., Eckle S.B., Meehan B.S., Jackson D.C., Strugnell R.A., Cao H., et al. . 2017. Mucosal-associated invariant T-cell activation and accumulation after in vivo infection depends on microbial riboflavin synthesis and co-stimulatory signals. Mucosal Immunol. 10:58–68. 10.1038/mi.2016.39 - DOI - PubMed

Publication types

MeSH terms

Substances