. 2018 Feb 5;215(2):423-440.
doi: 10.1084/jem.20171274. Epub 2018 Jan 16.

Cardiac macrophages promote diastolic dysfunction

Affiliations

Cardiac macrophages promote diastolic dysfunction

Maarten Hulsmans et al. J Exp Med. .

Abstract

Macrophages populate the healthy myocardium and, depending on their phenotype, may contribute to tissue homeostasis or disease. Their origin and role in diastolic dysfunction, a hallmark of cardiac aging and heart failure with preserved ejection fraction, remain unclear. Here we show that cardiac macrophages expand in humans and mice with diastolic dysfunction, which in mice was induced by either hypertension or advanced age. A higher murine myocardial macrophage density results from monocyte recruitment and increased hematopoiesis in bone marrow and spleen. In humans, we observed a parallel constellation of hematopoietic activation: circulating myeloid cells are more frequent, and splenic 18F-FDG PET/CT imaging signal correlates with echocardiographic indices of diastolic dysfunction. While diastolic dysfunction develops, cardiac macrophages produce IL-10, activate fibroblasts, and stimulate collagen deposition, leading to impaired myocardial relaxation and increased myocardial stiffness. Deletion of IL-10 in macrophages improves diastolic function. These data imply expansion and phenotypic changes of cardiac macrophages as therapeutic targets for cardiac fibrosis leading to diastolic dysfunction.


Figures

Figure 1.
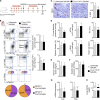
Figure 1.
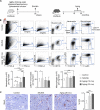
Cardiac macrophage expansion in diastolic dysfunction. (A) Experimental outline. Left: Mice were exposed to SAUNA; right: 18- and 30-mo-old C57BL/6 mice were used to study macrophages in aging. (B) Flow cytometric quantification of myeloid cell populations in hearts from control, SAUNA-exposed, and aged mice. Top: Representative flow cytometry plots; bottom: number of cell populations per milligram of heart tissue. Data are pooled from two (aging) to seven (SAUNA) independent experiments (n = 8–47 mice per group). Lin, lineage; mo, months; Mono/Macs, monocytes/macrophages. (C) Immunohistochemical analysis of macrophages in hearts from control, SAUNA-exposed, and aged mice. Left: Representative images; right: bar graph shows percentage of positive staining per ROI. Data are pooled from two independent experiments (n = 7–12 mice per group). Bar, 25 µm. Results are shown as mean ± SD. For statistical analysis, one-way ANOVA followed by Tukey’s test was performed for multiple comparisons. *, P < 0.05; **, P < 0.01; ***, P < 0.001; ****, P < 0.0001.
Figure 2.
Figure 2.
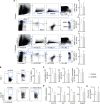
Ccr2-dependent monocyte recruitment contributes to cardiac macrophage expansion associated with diastolic dysfunction. (A) Flow cytometric quantification of monocytes and neutrophils in blood from control, SAUNA-exposed, and aged mice. Left: Representative flow cytometry plots; right: number of leukocytes and myeloid cells per milliliter of blood. Data are pooled from 2 (aging) to 11 (SAUNA) independent experiments (n = 8–89 mice per group). (B) Relative expression levels of different chemokines and adhesion molecules by qPCR in hearts from control, SAUNA-exposed, and aged mice. Data are pooled from two (aging) to four (SAUNA) independent experiments (n = 10–33 mice per group). (C) Flow cytometric quantification of myeloid cell populations in hearts from control and C57BL/6 and Ccr2−/− SAUNA-exposed mice. Left: Representative flow cytometry plots; right: number of cell populations per milligram of heart tissue. Data are pooled from three independent experiments (n = 14–15 mice per group). (D) Immunohistochemical analysis of macrophages in hearts from control and C57BL/6 and Ccr2−/− SAUNA-exposed mice. Left: Representative images; right: bar graph shows percentage of positive staining per ROI. Data are pooled from two independent experiments (n = 5–12 mice per group). Bar, 25 µm. (E) Relative Anp and Bnp expression levels by qPCR in hearts from control and C57BL/6 and Ccr2−/− SAUNA-exposed mice. Data are pooled from two independent experiments (n = 8–12 mice per group). (F) Lung wet-to-dry weight ratio in control and C57BL/6 and Ccr2−/− SAUNA-exposed mice. Data are pooled from two independent experiments (n = 4 mice per group). Results are shown as mean ± SD. For statistical analysis, one-way ANOVA followed by Tukey’s test was performed for multiple comparisons. *, P < 0.05; **, P < 0.01; ***, P < 0.001; ****, P < 0.0001.
Figure 3.
Figure 3.
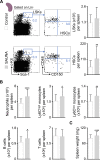
SAUNA increases bone marrow hematopoiesis. (A) Flow cytometric quantification of HSPCs in bone marrow from control and SAUNA-exposed mice. Left: Representative flow cytometry plots; right: number of HSPCs per femur. Data are pooled from at least two independent experiments (n = 10–36 mice per group). (B) BrdU pulse-chase experiment. Mice were exposed to BrdU in drinking water for 2 wk, which led to >70% BrdU labeling of HSCs (day 1). Additional cohorts of mice were exposed to SAUNA for 30 d or remained unexposed after BrdU labeling. The lower panel shows representative dot plots, and the bar graph shows quantification of BrdU retention in HSCs (day 30). Data are pooled from two independent experiments (n = 10 mice per group). (C) Number of leukocytes and myeloid cells per femur from control and SAUNA-exposed mice. Data are pooled from five independent experiments (n = 27–42 mice per group). (D) Retention factor expression by qPCR in bone marrow from control and SAUNA-exposed mice. Data are pooled from two independent experiments (n = 9–14 mice per group). (E) Blood CFU assay in control and SAUNA-exposed mice. Data are pooled from two independent experiments (n = 10–16 mice per group). Results are shown as mean ± SD. For statistical analysis, a two-tailed unpaired t test was performed to compare two groups. *, P < 0.05; ****, P < 0.0001.
Figure 4.
Figure 4.
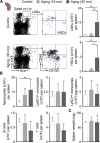
Aging expands bone marrow HSCs. Flow cytometric quantification of HSPCs in bone marrow from control and aged mice. Left: Representative flow cytometry plots; right: number of HSPCs per femur. Data are pooled from two independent experiments (n = 8–10 mice per group). Results are shown as mean ± SD. For statistical analysis, one-way ANOVA followed by Tukey’s test was performed for multiple comparisons. *, P < 0.05; ***, P < 0.001.
Figure 5.
Figure 5.
SAUNA induces splenic myelopoiesis. (A) Flow cytometric quantification of HSPCs in spleens from control and SAUNA-exposed mice. Left: Representative flow cytometry plots; right: number of HSPCs per spleen. Data are pooled from five independent experiments (n = 25–39 mice per group). (B) Number of splenic myeloid cells and lymphocytes in control and SAUNA-exposed mice. Data are pooled from five independent experiments (n = 27–42 mice per group). (C) Spleen weight in control and SAUNA-exposed mice. Data are pooled from 15 independent experiments (n = 102–103 mice per group). Results are shown as mean ± SD. For statistical analysis, a two-tailed unpaired t test was performed to compare two groups. *, P < 0.05; **, P < 0.01; ****, P < 0.0001.
Figure 6.
Figure 6.
Aging expands splenic HSCs. (A) Flow cytometric quantification of HSPCs in spleens from control and aged mice. Left: Representative flow cytometry plots; right: number of HSPCs per spleen. Data are pooled from two independent experiments (n = 8–10 mice per group). (B) Number of splenic myeloid cells and lymphocytes in control and aged mice. Data are pooled from two independent experiments (n = 8–10 mice per group). (C) Spleen weight in control and aged mice. Data are pooled from two independent experiments (n = 8–10 mice per group). Results are shown as mean ± SD. For statistical analysis, one-way ANOVA followed by Tukey’s test was performed for multiple comparisons. *, P < 0.05; **, P < 0.01.
Figure 7.
Figure 7.
Identification and validation of Il10 produced by cardiac macrophages as gene of interest. (A) Workflow and FACS gating strategy to purify macrophages from heart tissue. (B) Heat map of expression values (2-ΔCt) of fibrosis-related genes by qPCR in FACS-purified cardiac macrophages from control and SAUNA-exposed mice (n = 4 mice per group). (C) Relative Il10 expression levels by qPCR in macrophages FACS-sorted from a second, independent cohort of control and SAUNA-exposed mice (n = 8–9 mice per group). (D) Left: Il10 expression by qPCR in left ventricle and FACS-purified cardiac macrophages, fibroblasts, and endothelial cells from C57BL/6 mice (n = 6–9 mice per group); right: FACS gating strategy to purify macrophages, fibroblasts, and endothelial cells from heart tissue. (E) Relative Il10 expression levels by qPCR in hearts from control and aged mice. Data are pooled from two independent experiments (n = 7–9 mice per group). (F) Relative Il10 expression levels by qPCR in hearts and kidneys from control and SAUNA-exposed mice. Data are pooled from two independent experiments (n = 7–15 mice per group). (G) PCR analysis of FACS-purified Cx3cr1wt/wt and Cx3cr1wt/CreER cardiac macrophages 7 d after tamoxifen treatment for the presence of wild-type (Il10wt) and conditional undeleted (Il10fl) or deleted (Il10Δ) Il10 alleles. Results are shown as mean ± SD. For statistical analysis, a two-tailed unpaired t test was performed to compare two groups, and one-way ANOVA followed by Tukey’s test was performed for multiple comparisons. *, P < 0.05; **, P < 0.01.
Figure 8.
Figure 8.
Macrophage-restricted IL-10 deletion in SAUNA-exposed mice improves diastolic function. (A) Experimental outline of the SAUNA protocol applied on mice lacking IL-10. (B) Flow cytometric quantification of neutrophils and macrophages in hearts from littermate and Cx3cr1 Il10−/− SAUNA-exposed mice. Left: Representative flow cytometry plots; right: number of neutrophils and macrophages per milligram of heart tissue. The pie charts indicate the percentage of MHCIIlow (orange) and MHCIIhigh (purple) cardiac macrophages. Data are pooled from two independent experiments (n = 14–16 mice per group). (C) Immunohistochemical analysis of macrophages in hearts from littermate and Cx3cr1 Il10−/− SAUNA-exposed mice. Left: Representative images; right: bar graph shows percentage of positive staining per ROI. Data are pooled from two independent experiments (n = 6–7 mice per group). Bar, 25 µm. (D) Hemodynamic parameters by pressure–volume catherization of hearts from littermate and Cx3cr1 Il10−/− SAUNA-exposed mice. Data are pooled from two independent experiments (n = 7–11 mice per group). (E) Serum creatinine levels in littermate and Cx3cr1 Il10−/− SAUNA-exposed mice. Data are pooled from two independent experiments (n = 6 mice per group). (F) Systolic blood pressure in littermate and Cx3cr1 Il10−/− SAUNA-exposed mice. Data are pooled from six independent experiments (n = 38–46 mice per group). (G) Relative Anp and Bnp expression levels by qPCR in hearts from littermate and Cx3cr1 Il10−/− SAUNA-exposed mice. Data are pooled from four independent experiments (n = 27 mice per group). (H) Lung wet-to-dry weight ratio in littermate and Cx3cr1 Il10−/− SAUNA-exposed mice. Data are pooled from five independent experiments (n = 32–39 mice per group). Results are shown as mean ± SD. For statistical analysis, a two-tailed unpaired t test was performed to compare two groups. *, P < 0.05; **, P < 0.01; ***, P < 0.001.
Figure 9.
Figure 9.
IL-10 produced by cardiac macrophages indirectly activates fibroblasts. (A) Mean fluorescence intensities (MFI) indicating ROS production in cardiac fibroblasts from littermate and Cx3cr1 Il10−/− SAUNA-exposed mice. Data are pooled from two independent experiments (n = 11 mice per group). (B) Flow cytometric quantification of fibroblasts in hearts from littermate and Cx3cr1 Il10−/− SAUNA-exposed mice. Left: Representative flow cytometry plots; right: number of fibroblasts per milligram of heart tissue. Data are pooled from two independent experiments (n = 11–15 mice per group). RMCs, resident mesenchymal cells. (C) Relative Opn expression levels by qPCR in control and rIL-10–exposed FACS-purified cardiac macrophages. Data are pooled from two independent experiments (n = 10 per group). (D) Relative Col1a2 and Fn1 expression levels by qPCR in FACS-purified cardiac fibroblasts incubated with rIL-10, control macrophage (mac) medium or rIL-10–exposed mac medium with and without OPN or TGFβ neutralizing antibody (Ab). Data are pooled from two independent experiments (n = 4–7 per group). (E) Left: Representative immunofluorescence images of FACS-purified cardiac fibroblasts incubated with control or rIL-10–exposed mac medium, and stained with α-SMA (green), Phalloidin to identify actin filaments (red), and DAPI (blue); right: bar graphs show percentage of positive α-SMA or actin staining per ROI. Data are pooled from two independent experiments (n = 7 per group). Bar, 50 µm. (F) Relative Opn and Tgfb1 expression levels by qPCR in hearts from littermate and Cx3cr1 Il10−/− SAUNA-exposed mice. Data are pooled from at least two independent experiments (n = 8–15 mice per group). (G) Histological analysis of collagen deposition (PicroSirius Red) in hearts from littermate and Cx3cr1 Il10−/− SAUNA-exposed mice. Left: Representative images; right: bar graph shows percentage of positive staining per ROI. Data are pooled from two independent experiments (n = 6 mice per group). Bar, 50 µm. Results are shown as mean ± SD. For statistical analysis, a two-tailed unpaired t test was performed to compare two groups, and one-way ANOVA followed by Tukey’s test was performed for multiple comparisons. *, P < 0.05; **, P < 0.01; ***, P < 0.001; ****, P < 0.0001.
Figure 10.
Figure 10.
Summary cartoon. Systemic inflammation and impaired LV diastolic function are seen in both hypertension and physiological aging. Circulating monocytes and myocardial macrophage density are increased in diastolic dysfunction, and the macrophage expansion is partially driven by monocyte recruitment. Blood monocytosis derives from increased production in the bone marrow and spleen. Mechanistically, cardiac macrophages produce more IL-10 leading to their autocrine activation toward a fibrogenic phenotype. A profibrotic macrophage subset secretes more OPN and fewer proteases and MMPs, contributing to fibroblast activation, collagen deposition, and subsequently increased myocardial stiffness and diastolic dysfunction.

Comment in

References

    1. Alili L., Sack M., Puschmann K., and Brenneisen P.. 2014. Fibroblast-to-myofibroblast switch is mediated by NAD(P)H oxidase generated reactive oxygen species. Biosci. Rep. 34:00089 10.1042/BSR20130091 - DOI - PMC - PubMed
    1. Ather S., Chan W., Bozkurt B., Aguilar D., Ramasubbu K., Zachariah A.A., Wehrens X.H., and Deswal A.. 2012. Impact of noncardiac comorbidities on morbidity and mortality in a predominantly male population with heart failure and preserved versus reduced ejection fraction. J. Am. Coll. Cardiol. 59:998–1005. 10.1016/j.jacc.2011.11.040 - DOI - PMC - PubMed
    1. Beerman I., Bhattacharya D., Zandi S., Sigvardsson M., Weissman I.L., Bryder D., and Rossi D.J.. 2010. Functionally distinct hematopoietic stem cells modulate hematopoietic lineage potential during aging by a mechanism of clonal expansion. Proc. Natl. Acad. Sci. USA. 107:5465–5470. 10.1073/pnas.1000834107 - DOI - PMC - PubMed
    1. Beerman I., Bock C., Garrison B.S., Smith Z.D., Gu H., Meissner A., and Rossi D.J.. 2013. Proliferation-dependent alterations of the DNA methylation landscape underlie hematopoietic stem cell aging. Cell Stem Cell. 12:413–425. 10.1016/j.stem.2013.01.017 - DOI - PubMed
    1. Dykstra B., Olthof S., Schreuder J., Ritsema M., and de Haan G.. 2011. Clonal analysis reveals multiple functional defects of aged murine hematopoietic stem cells. J. Exp. Med. 208:2691–2703. 10.1084/jem.20111490 - DOI - PMC - PubMed

Publication types

MeSH terms