. 2018 Jan 30;115(5):1117-1122.
doi: 10.1073/pnas.1710323115. Epub 2018 Jan 16.

Laminar recordings in frontal cortex suggest distinct layers for maintenance and control of working memory

Affiliations

Laminar recordings in frontal cortex suggest distinct layers for maintenance and control of working memory

André M Bastos et al. Proc Natl Acad Sci U S A. .

Abstract

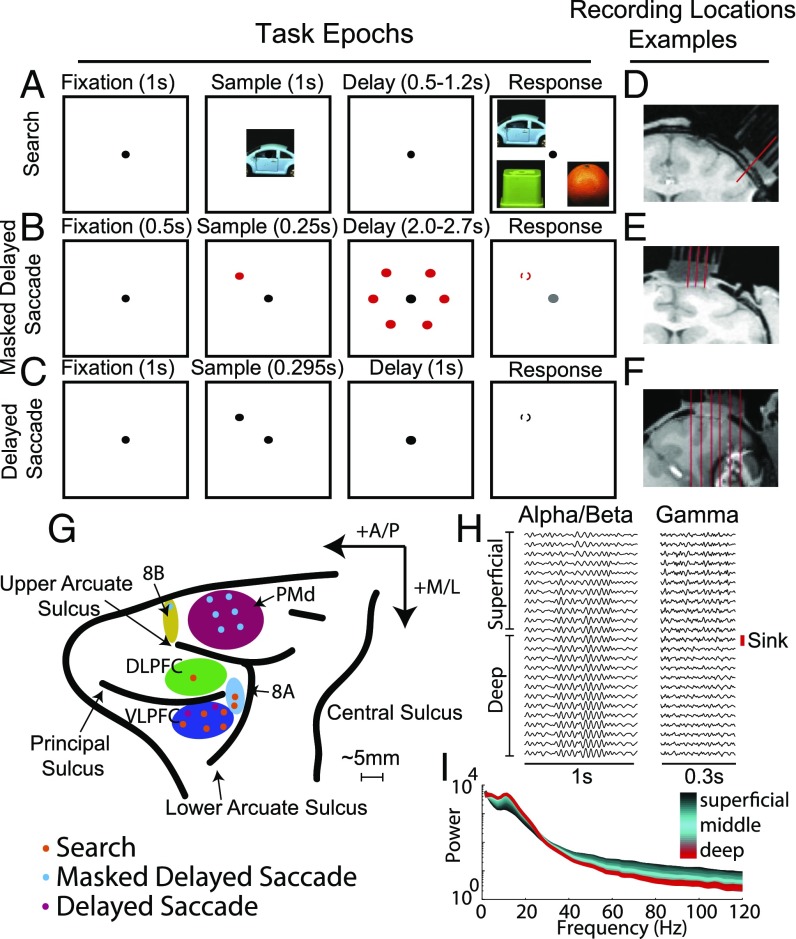
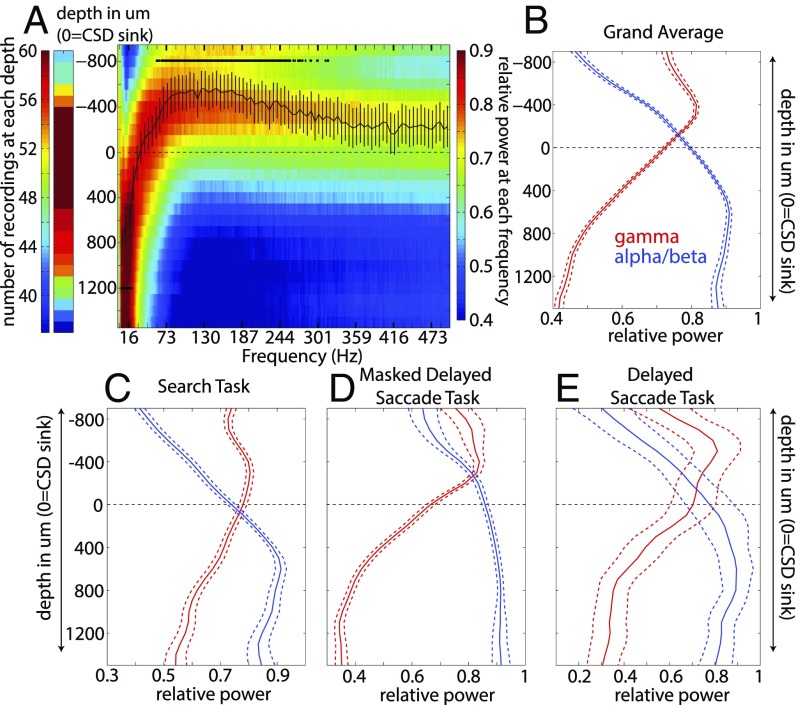
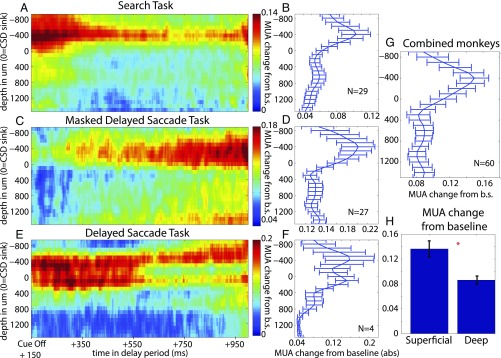
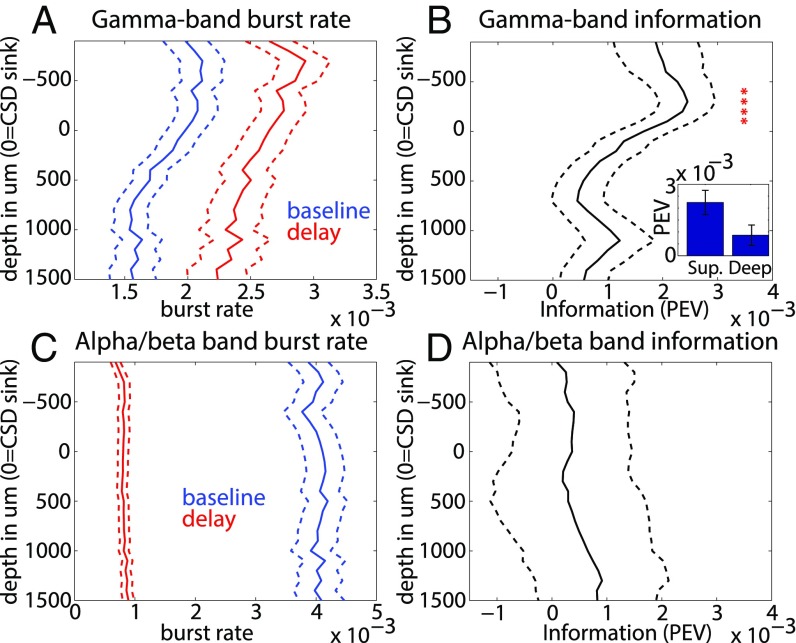
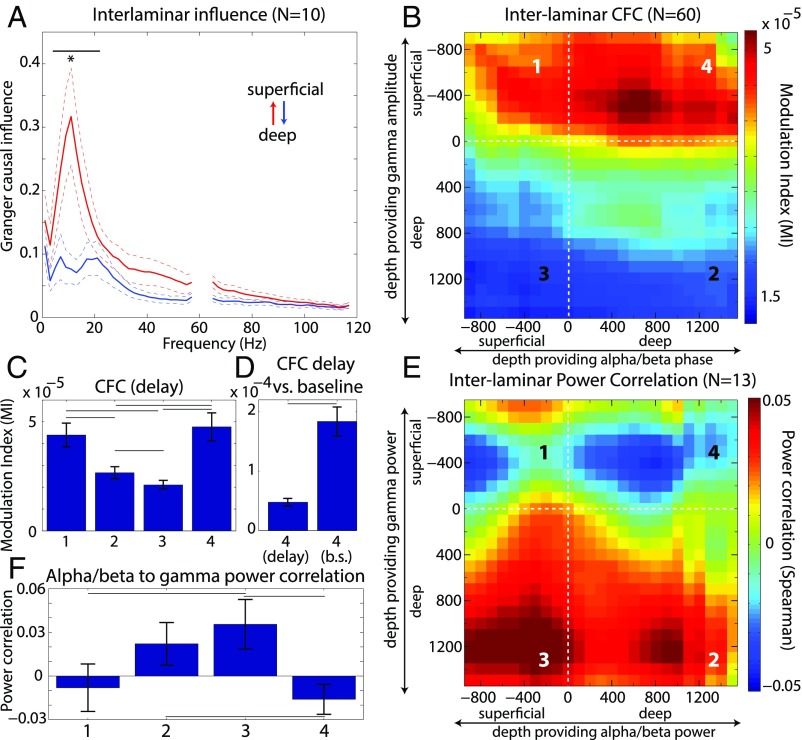
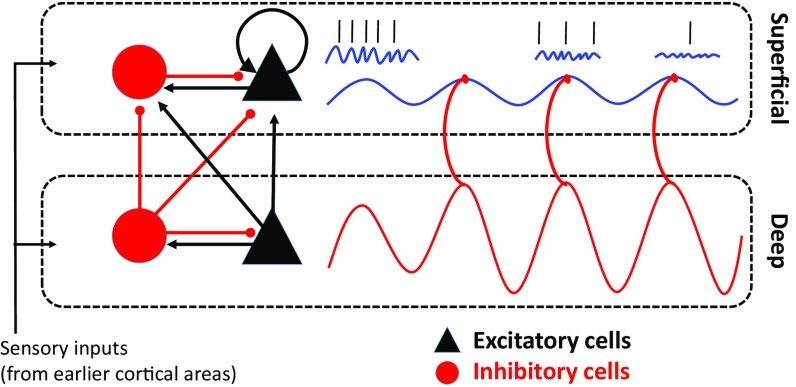
All of the cerebral cortex has some degree of laminar organization. These different layers are composed of neurons with distinct connectivity patterns, embryonic origins, and molecular profiles. There are little data on the laminar specificity of cognitive functions in the frontal cortex, however. We recorded neuronal spiking/local field potentials (LFPs) using laminar probes in the frontal cortex (PMd, 8A, 8B, SMA/ACC, DLPFC, and VLPFC) of monkeys performing working memory (WM) tasks. LFP power in the gamma band (50-250 Hz) was strongest in superficial layers, and LFP power in the alpha/beta band (4-22 Hz) was strongest in deep layers. Memory delay activity, including spiking and stimulus-specific gamma bursting, was predominately in superficial layers. LFPs from superficial and deep layers were synchronized in the alpha/beta bands. This was primarily unidirectional, with alpha/beta bands in deep layers driving superficial layer activity. The phase of deep layer alpha/beta modulated superficial gamma bursting associated with WM encoding. Thus, alpha/beta rhythms in deep layers may regulate the superficial layer gamma bands and hence maintenance of the contents of WM.

Keywords: cortical layers; frontal cortex; oscillations; working memory.


Conflict of interest statement

The authors declare no conflict of interest.

Figures

Fig. 1.
Fig. 1.
(A) Visual search task. A match between sample and test image was chosen after a delay (0.5–1.2 s) by making a saccade to the match. Each image was positioned randomly at any one of four possible locations (Upper Right, Lower Right, Upper Left, and Lower Left). (B) Masked delayed saccade. After a sample period, during which a single spatial location was cued (one of six possible locations), the animal had to hold fixation through a variable delay (2.2–2.7 s) and the presentation of the visual mask. After this delay, and when the fixation point color changed, the animal had to saccade to the previously cued location. (C) Delayed saccade. After a sample period, during which a single spatial location was cued (one of four possible locations), the animal had to hold fixation through a fixed delay (0.99 s) and saccade to the cued location when the fixation dot disappeared. (D and E) The small red lines indicate sample trajectories chosen to be as perpendicular as possible to cortex. (F) The small red lines indicate sample trajectories that were possible given the recording hardware. Only the third trajectory from the left was used for laminar recordings. (G) We recorded across frontal cortex. The different colored dots indicate the task, and the letters indicate the corresponding anatomic region. In addition to those labeled, we recorded from the anterior cingulate cortex (ACC) and the supplementary motor area (SMA) (SI Appendix, Fig. S12). (H) Sample LFP recordings were bandpass-filtered at 10–25 Hz (Left) and 40–160 Hz (Right). The red line marks the location of the first significant CSD sink and the border between the superficial and deep layers. (I) A sample power spectrum with a clear alpha/beta bump (between 10 and 25 Hz) and broadband gamma (>40 Hz). The variations across layers are plotted as a color gradient (black, superficial to red, deep).
Fig. 2.
Fig. 2.
(A) Number of LFP recordings performed per depth (Left) and normalized power averaged across multicontact probes with respect to depth and frequency (Right). Red indicates greater power at a particular depth; blue, less power. The black line represents the average depth at which the power at each frequency peaks. Error bars ± 1 SEM. The black stars indicate frequency bins at which the mean depth was significantly different from zero (Bonferroni- corrected for multiple comparisons). (B) Normalized power averaged across low (4–22 Hz, blue line) and high (50–250 Hz, red line) frequencies. Error bars ± 1 SEM. (CE) Normalized power profiles across low and high frequencies for each task. Error bars ± 1 SEM.
Fig. 3.
Fig. 3.
(A, C, and E) Delay period, MUA modulation across cortical depth and time, plotted from 150 ms after sample offset to 1 s into the delay, for the visual search, masked delayed saccade, and delayed saccade tasks. (B, D, and F) The mean delay period MUA modulation per cortical depth for each task. Error bars ± 1 SEM. (G) The delay period MUA modulation averaged across all tasks per cortical depth. Error bars ± 1 SEM. (H) The mean MUA modulation averaged across all tasks, and all superficial or deep contacts. Error bars ± 1 SEM.
Fig. 4.
Fig. 4.
(A) Gamma burst rates at baseline (blue) and during the delay (red). (B) Percentage of explained variance (omega-squared) of the gamma bursts across different cortical depths. Red asterisks indicate depths at which there is significantly nonzero PEV across sessions (P < 0.05, Bonferroni-corrected). (Inset) Mean PEV across all superficial and deep contacts, respectively. Error bars ± 1 SEM. (C) Same as A, but for alpha/beta. (D) PEV of alpha/beta bursts across different cortical depths. Error bars ± 1 SEM.
Fig. 5.
Fig. 5.
(A) The Granger causal (GC) influence across frequency during the delay period. The red line is the GC of deep to superficial layers, and the blue is the reverse. Only sessions in which two laminar probes were placed within 2–4 mm of one another were used (see SI Appendix, Experimental Procedures). (B) Cross Frequency Coupling (CFC) between the phase of alpha/beta oscillations and the amplitude of gamma oscillations. Plotted across both axes is the CFC between specific cortical depths. (C) The mean CFC across all four possible laminar combinations during the delay-period: superficial phase to superficial amplitude (Left, 1), deep phase to deep amplitude (Middle-Left, 2), superficial phase to deep amplitude (Middle-Right, 3), and deep phase to superficial amplitude (Right, 4). (D) CFC between deep phase to superficial amplitude during the delay (Left) and the baseline (Right). (E) Correlation map between the power of alpha/beta and gamma over the delay period. Only recordings with a fixed delay period were used (four recordings from the delayed saccade task, nine from the search task). (F) Average power correlation between alpha/beta and gamma for all four possible laminar combinations. Same numbering scheme for laminar combinations as in C. Error bars ± 1 SEM. Lines indicate significantly different comparisons at P < 0.05.
Fig. 6.
Fig. 6.
A model of WM. Denoted by two rectangular, dashed boxes, two cortical compartments, superficial and deep, are made up of densely interconnected pyramidal (black) and inhibitory (red) neurons. Inhibitory connections are line segments with a red, rounded end, and excitatory connections are line segments with a black, arrow end. The looping arrow returning on itself represents the recurrent connectivity found within layer 3 pyramidal cell networks in prefrontal cortex. The sinusoidal red-line in deep layers reflects the predominance of alpha/beta oscillations deep and their driving influence on superficial alpha/beta oscillations (the sinusoidal blue line). Alpha/beta oscillations are coupled with gamma oscillations (blue squiggly lines), and these gamma oscillations organize informative spiking (straight black marks). Over time, moving from left to right in the figure, the deep alpha/beta suppresses both superficial gamma and spiking, which would “clear out” the contents of WM.

References

    1. Goldman-Rakic PS. Regional and cellular fractionation of working memory. Proc Natl Acad Sci USA. 1996;93:13473–13480. - PMC - PubMed
    1. Sawaguchi T, Matsumura M, Kubota K. Catecholaminergic effects on neuronal activity related to a delayed response task in monkey prefrontal cortex. J Neurophysiol. 1990;63:1385–1400. - PubMed
    1. Markowitz DA, Curtis CE, Pesaran B. Multiple component networks support working memory in prefrontal cortex. Proc Natl Acad Sci USA. 2015;112:11084–11089. - PMC - PubMed
    1. Bollimunta A, Mo J, Schroeder CE, Ding M. Neuronal mechanisms and attentional modulation of corticothalamic α oscillations. J Neurosci. 2011;31:4935–4943. - PMC - PubMed
    1. Buffalo EA, Fries P, Landman R, Buschman TJ, Desimone R. Laminar differences in gamma and alpha coherence in the ventral stream. Proc Natl Acad Sci USA. 2011;108:11262–11267. - PMC - PubMed

Publication types

LinkOut - more resources