

Streamlined circular proximity ligation assay provides high stringency and compatibility with low-affinity antibodies
- PMID: 29339495
- PMCID: PMC5798375
- DOI: 10.1073/pnas.1718283115
Streamlined circular proximity ligation assay provides high stringency and compatibility with low-affinity antibodies
Abstract
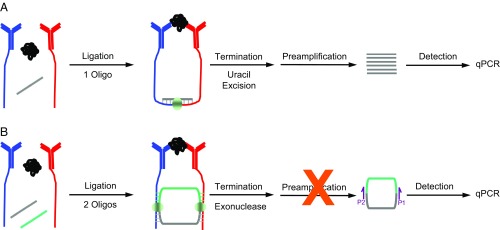
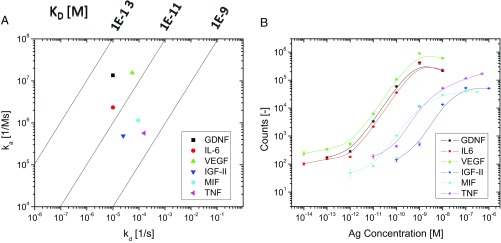
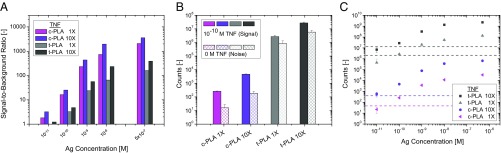
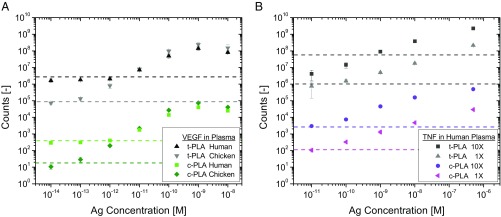
Proximity ligation assay (PLA) is a powerful tool for quantitative detection of protein biomarkers in biological fluids and tissues. Here, we present the circular proximity ligation assay (c-PLA), a highly specific protein detection method that outperforms traditional PLA in stringency, ease of use, and compatibility with low-affinity reagents. In c-PLA, two proximity probes bind to an analyte, providing a scaffolding that positions two free oligonucleotides such that they can be ligated into a circular DNA molecule. This assay format stabilizes antigen proximity probe complexes and enhances stringency by reducing the probability of random background ligation events. Circle formation also increases selectivity, since the uncircularized DNA can be removed enzymatically. We compare this method with traditional PLA on several biomarkers and show that the higher stringency for c-PLA improves reproducibility and enhances sensitivity in both buffer and human plasma. The limit of detection ranges from femtomolar to nanomolar concentrations for both methods. Kinetic analyses using surface plasmon resonance (SPR) and biolayer interferometry (BLI) reveal that the variation in limit of detection is due to the variation in antibody affinity and that c-PLA outperforms traditional PLA for low-affinity antibodies. The lower background signal can be used to increase proximity probe concentration while maintaining a high signal-to-noise ratio, thereby enabling the use of low-affinity reagents in a homogeneous assay format. We anticipate that the advantages of c-PLA will be useful in a variety of clinical protein detection applications where high-affinity reagents are lacking.
Keywords: antibody affinity; immuno-PCR; kinetic analysis; proximity ligation assay; qPCR.
Conflict of interest statement
Conflict of interest statement: S.F. owns stock in a company (Olink AB) with patents on the core technology described, "Proximity Ligation Assay."
Figures

Similar articles
-
SH2-PLA: a sensitive in-solution approach for quantification of modular domain binding by proximity ligation and real-time PCR.BMC Biotechnol. 2015 Jun 26;15:60. doi: 10.1186/s12896-015-0169-1. BMC Biotechnol. 2015. PMID: 26112401 Free PMC article.
-
Protein tag-mediated conjugation of oligonucleotides to recombinant affinity binders for proximity ligation.N Biotechnol. 2013 Jan 25;30(2):144-52. doi: 10.1016/j.nbt.2012.05.005. Epub 2012 Jun 2. N Biotechnol. 2013. PMID: 22664266
-
Bright-field microscopy visualization of proteins and protein complexes by in situ proximity ligation with peroxidase detection.Clin Chem. 2010 Jan;56(1):99-110. doi: 10.1373/clinchem.2009.134452. Epub 2009 Nov 19. Clin Chem. 2010. PMID: 19926775
-
Proximity ligation assay: an ultrasensitive method for protein quantification and its applications in pathogen detection.Appl Microbiol Biotechnol. 2021 Feb;105(3):923-935. doi: 10.1007/s00253-020-11049-1. Epub 2021 Jan 11. Appl Microbiol Biotechnol. 2021. PMID: 33427935 Review.
-
Protein biomarker validation via proximity ligation assays.Biochim Biophys Acta. 2014 May;1844(5):933-9. doi: 10.1016/j.bbapap.2013.07.016. Epub 2013 Aug 7. Biochim Biophys Acta. 2014. PMID: 23933049 Review.
Cited by
-
Nucleic-Acid Driven Cooperative Bioassays Using Probe Proximity or Split-Probe Techniques.Anal Chem. 2021 Jan 12;93(1):198-214. doi: 10.1021/acs.analchem.0c04364. Epub 2020 Nov 4. Anal Chem. 2021. PMID: 33147015 Free PMC article. Review.
-
Visualization of Individual RNA Molecules by Proximity Ligation-Based Chromogenic In Situ Hybridization Assay.Methods Mol Biol. 2024;2822:143-156. doi: 10.1007/978-1-0716-3918-4_11. Methods Mol Biol. 2024. PMID: 38907917
-
Extending the dynamic range of biomarker quantification through molecular equalization.Nat Commun. 2023 Jul 13;14(1):4192. doi: 10.1038/s41467-023-39772-z. Nat Commun. 2023. PMID: 37443317 Free PMC article.
-
High-Fidelity Nanopore Sequencing of Ultra-Short DNA Targets.Anal Chem. 2019 May 21;91(10):6783-6789. doi: 10.1021/acs.analchem.9b00856. Epub 2019 May 10. Anal Chem. 2019. PMID: 31038923 Free PMC article.
-
Molecular and Biochemical Techniques for Deciphering p53-MDM2 Regulatory Mechanisms.Biomolecules. 2020 Dec 30;11(1):36. doi: 10.3390/biom11010036. Biomolecules. 2020. PMID: 33396576 Free PMC article. Review.
References
-
- Landegren U, et al. Opportunities for sensitive plasma proteome analysis. Anal Chem. 2012;84:1824–1830. - PubMed
-
- Wild D, editor. The Immunoassay Handbook. Elsevier; Oxford: 2013.
-
- Zhang H, Zhao Q, Li XF, Le XC. Ultrasensitive assays for proteins. Analyst (Lond) 2007;132:724–737. - PubMed
-
- Spengler M, Adler M, Niemeyer CM. Highly sensitive ligand-binding assays in pre-clinical and clinical applications: Immuno-PCR and other emerging techniques. Analyst (Lond) 2015;140:6175–6194. - PubMed
Publication types
MeSH terms
Substances
Grants and funding
LinkOut - more resources
Full Text Sources
Other Literature Sources
