. 2018 Jan 16;25(2):54-66.
doi: 10.1101/lm.046284.117. Print 2018 Feb.

Chronic dietary creatine enhances hippocampal-dependent spatial memory, bioenergetics, and levels of plasticity-related proteins associated with NF-κB

Affiliations

Chronic dietary creatine enhances hippocampal-dependent spatial memory, bioenergetics, and levels of plasticity-related proteins associated with NF-κB

Wanda M Snow et al. Learn Mem. .

Abstract

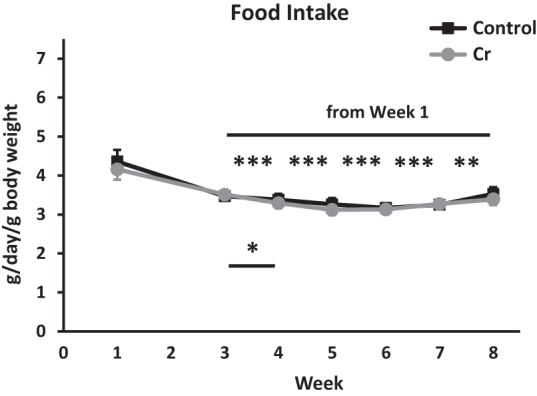
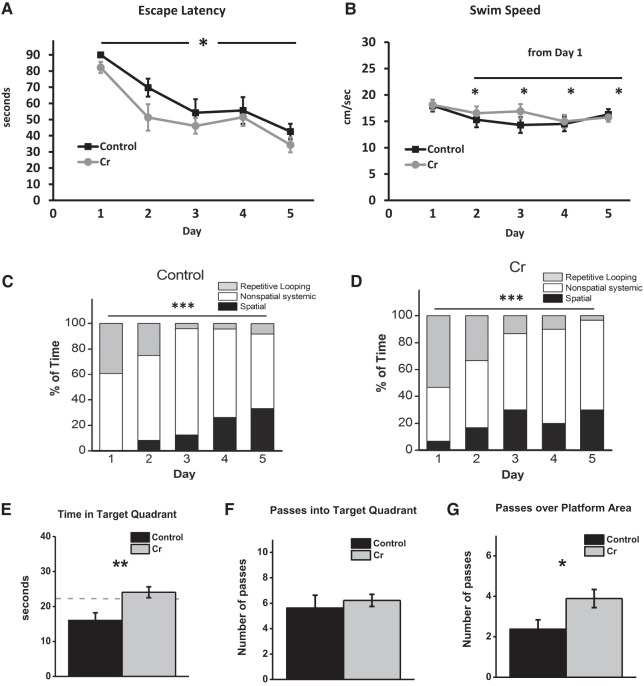
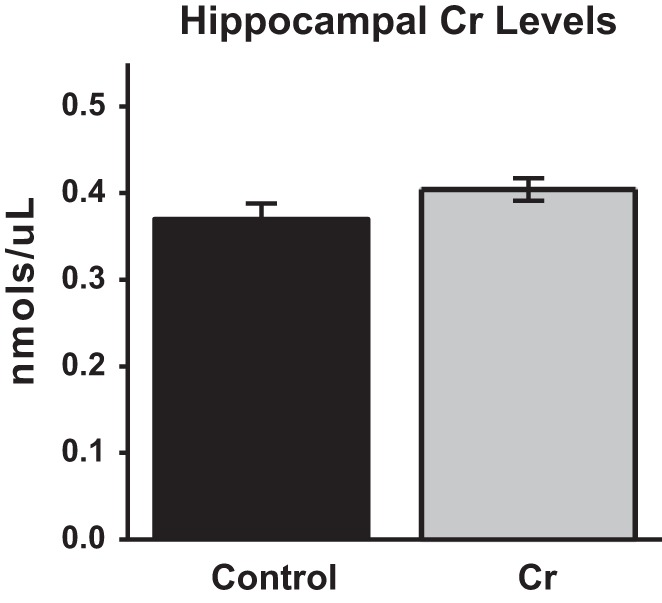
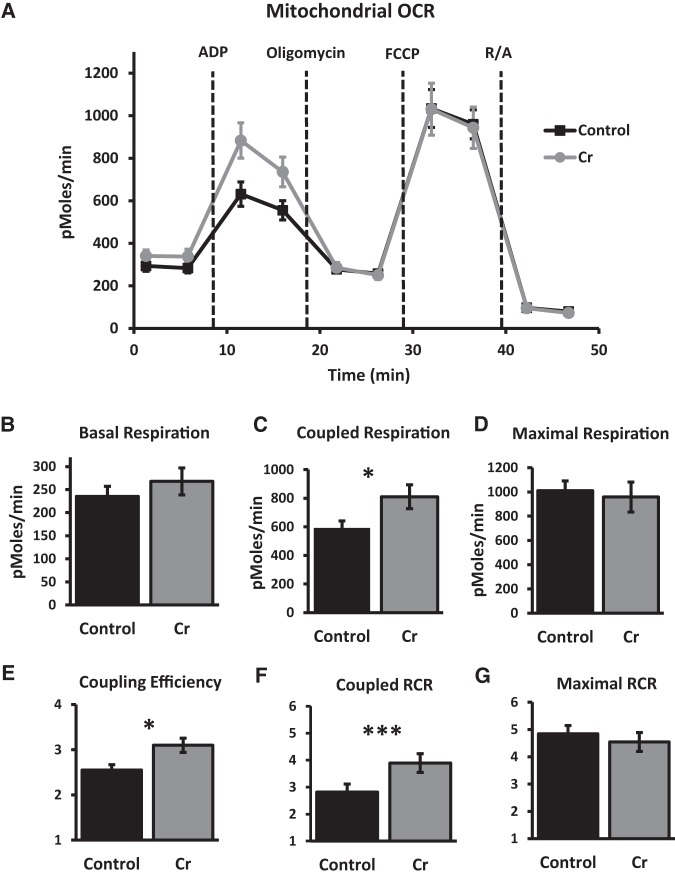
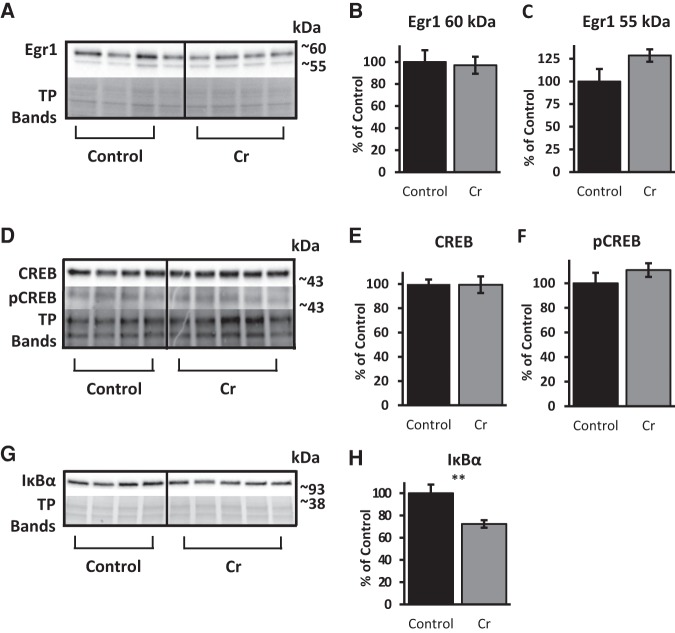
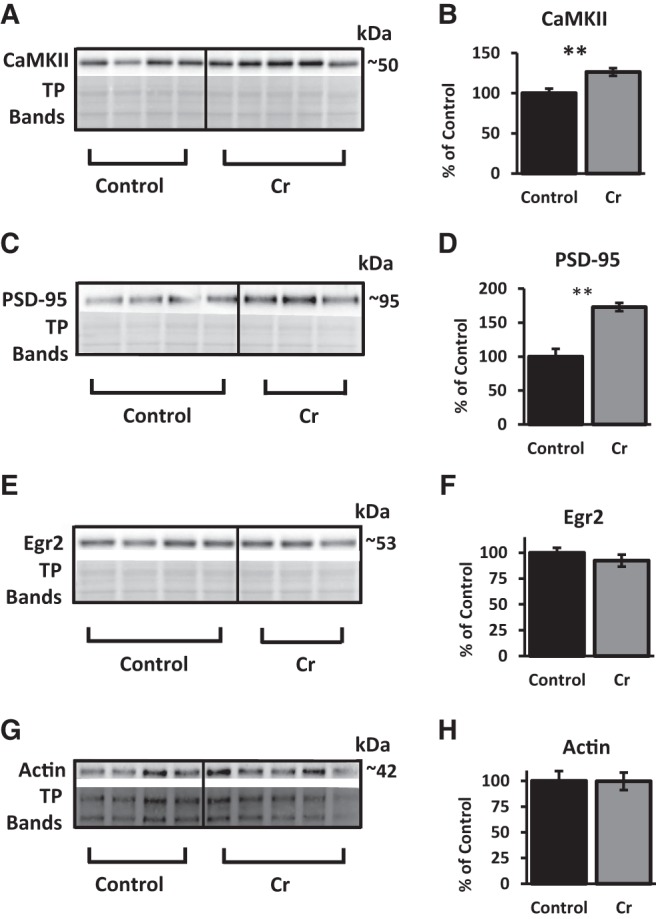
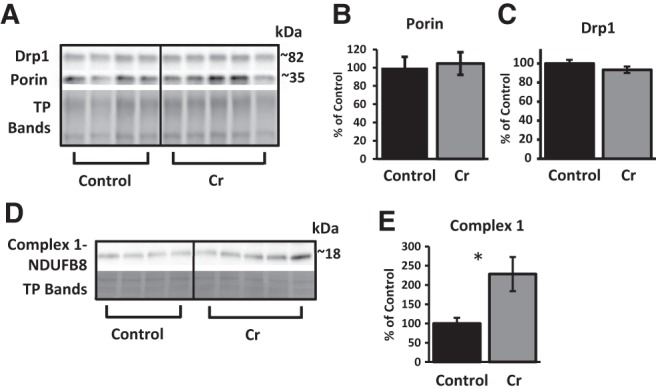
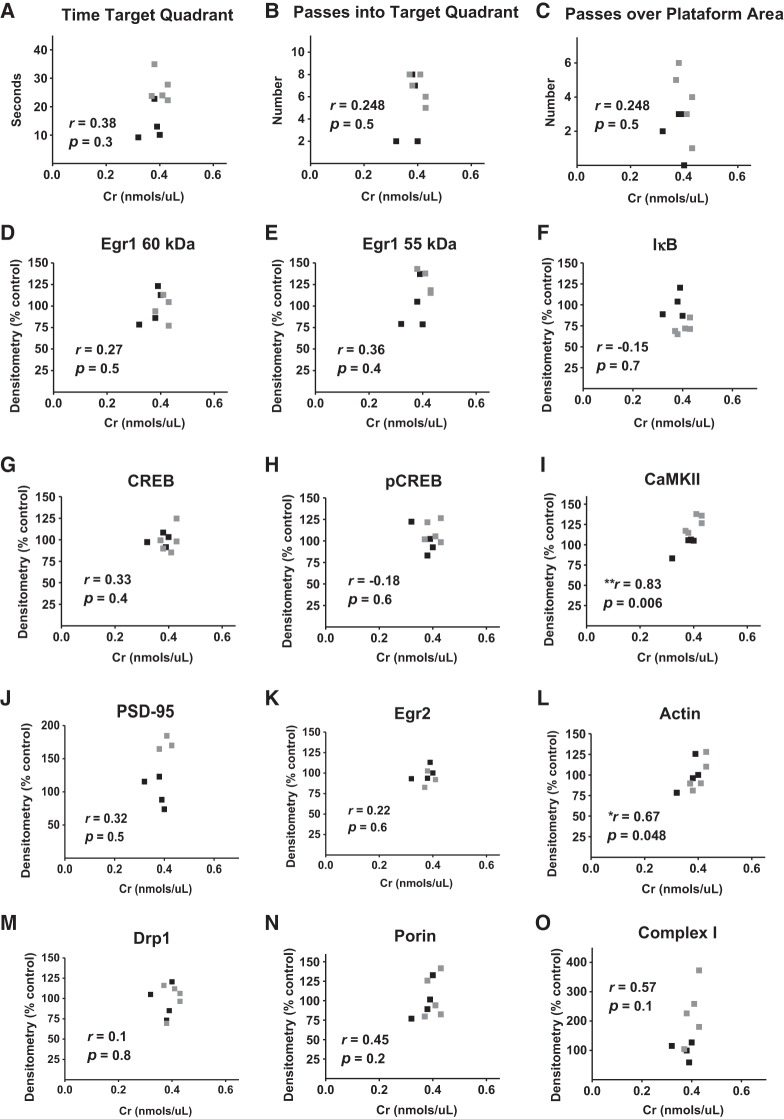
The brain has a high demand for energy, of which creatine (Cr) is an important regulator. Studies document neurocognitive benefits of oral Cr in mammals, yet little is known regarding their physiological basis. This study investigated the effects of Cr supplementation (3%, w/w) on hippocampal function in male C57BL/6 mice, including spatial learning and memory in the Morris water maze and oxygen consumption rates from isolated mitochondria in real time. Levels of transcription factors and related proteins (CREB, Egr1, and IκB to indicate NF-κB activity), proteins implicated in cognition (CaMKII, PSD-95, and Egr2), and mitochondrial proteins (electron transport chain Complex I, mitochondrial fission protein Drp1) were probed with Western blotting. Dietary Cr decreased escape latency/time to locate the platform (P < 0.05) and increased the time spent in the target quadrant (P < 0.01) in the Morris water maze. This was accompanied by increased coupled respiration (P < 0.05) in isolated hippocampal mitochondria. Protein levels of CaMKII, PSD-95, and Complex 1 were increased in Cr-fed mice, whereas IκB was decreased. These data demonstrate that dietary supplementation with Cr can improve learning, memory, and mitochondrial function and have important implications for the treatment of diseases affecting memory and energy homeostasis.


Figures

Figure 1.
Figure 1.
Food intake as a function of diet. Plot depicting food intake in adult (7-mo-old) control mice and mice supplemented with Cr. Food intake (g) was measured twice/week over the 8–9-wk dietary intervention, averaged across the week, and expressed as g/day (mean ± SEM depicted). The g/day value was divided by the animal's body weight to account for variations in food intake based on body weight. Data were analyzed by two-way ANOVA, followed by Fisher's LSD post hoc comparisons for the 7 wk for which intake data were available (no data for week 2). Control: n = 8; Cr: n = 10; (*) P < 0.05; (**) P < 0.01; (***) P < 0.001.
Figure 2.
Figure 2.
MWM as a function of diet. (AD) Spatial learning in the acquisition phase. In male mice, oral Cr significantly decreased escape latency (time to locate the platform; mean ± SEM) overall across training days, indicating enhanced learning of the spatial task. n = 8–10; P < 0.05; two-way ANOVA. (B) Swim speed (mean ± SEM) was assessed by two-way ANOVA to rule out enhanced motor performance as a contributing to factor to decreased latency. Swim speed decreased from the first day of training (P < 0.05) overall, as diet did not influence swim speed. (C) The frequency of use (% of total) of various search strategies (operationally defined as per Brody and Holtzman 2006) was calculated across training days for control and (D) Cr-fed mice and analyzed using Chi-square tests. In both groups, the frequency of use of various strategies differed across training days ((***) P < 0.001). Spatial strategies increased across training days, with the frequency of use peaking earlier in Cr-fed mice, although the difference fell short of significance (p = 0.06). Control: n = 8; Cr: n = 10. (EG). Memory retention on the sixth day of the MWM after removal of the platform. The platform was removed, and mice were allowed 90 sec to swim. Memory retention (mean ± SEM) was evaluated in mice with and without oral Cr by measuring (E) time in target quadrant, (F) passes into the target quadrant, and (G) passes over the platform area. Student's t-test; dotted line indicates chance level. Control: n = 8; Cr: n = 9; (*) P < 0.05; (**) P < 0.01.
Figure 3.
Figure 3.
Hippocampal Cr levels after 8–9 wk of dietary intervention. Cr levels were evaluated in hippocampal homogenates using a colorimetric kit (BioVision Inc). Control: n = 4; Cr: n = 5; P > 0.05; Student's t-test.
Figure 4.
Figure 4.
OCR in mitochondria isolated from the hippocampus after MWM training in control and Cr-fed mice. (A) Kinetics graphing indicating real-time OCR at baseline and after addition of substrates ADP, oligomycin, FCCP, and rotenone/antimycin (R/A) in 10 µg of mitochondrial protein per well. (B) Basal respiration, (C) coupled respiration, and (D) maximal respiration (mean ± SEM) were calculated after subtracting nonmitochondrial respiration (after R/A) and compared between control and Cr-fed mice. (E) Coupling efficiency was calculated by dividing coupled respiration (after addition of ADP) by basal respiration. (F) Coupled RCR was calculated by dividing coupled respiration rates (after ADP) by OCR after oligomycin. (G) Maximal RCR was calculated by dividing maximal respiration rates (after FCCP) by OCR after oligomycin. Student's t-test; n = 9–10 wells per group; (*) P < 0.05; (***) P < 0.001.
Figure 5.
Figure 5.
Relative levels of transcription factors and related proteins in the hippocampus of MWM-trained mice as a function of diet. Representative Western blots detecting (A) Egr1, (D) CREB, and (G) IκBα. Total protein bands were visualized with Ponceau S staining (in A and G) or with TGX Stain-Free gels (Bio-Rad) in D; representative bands shown to indicate loading across samples. Samples from each group were immunoblotted on the same gels for comparison. Bar graphs depict densitometry values of (B) ∼60 kDa (C) and ∼55 kDa bands detected with anti-Egr1 as well as (E) CREB and (H) IκBα after normalizing to total protein bands (expressed as the percentage change from control means of 100% ±SEM. (F) Bar graph depicting densitometry values of pCREB, normalized to total CREB band (% change from control mean set at 100% ±SEM). Student's t-test; n = 4–5; (**) P ≤ 0.01.
Figure 6.
Figure 6.
Relative levels of NF-κB-associated plasticity proteins in the hippocampus of MWM-trained mice as a function of diet. (A,B) Representative Western blot and bar graph (percent change from control mean of 100% ±SEM) depicting CaMKII levels in trained mice after normalizing to total protein (Ponceau S staining). (C,D) Representative Western blot and bar graph (% change from control mean of 100% ±SEM) depicting PSD-95 levels in trained mice after normalizing to total protein (Ponceau S staining). (E,F) Representative Western blot and bar graph (% change from control mean of 100% ±SEM) depicting Egr2 levels in trained mice after normalizing to total protein (Ponceau S staining). (G,H) Representative Western blot and bar graph (% change from control mean of 100% ±SEM) depicting actin levels in trained mice after normalizing to total protein (TGX Stain-Free gels; Bio-Rad). Student's t-test; n = 3–5; (**) P < 0.01.
Figure 7.
Figure 7.
Relative levels of mitochondrial proteins in the hippocampus of MWM-trained mice as a function of diet. (A) Representative Western blot detecting Drp1, porin, and total protein (with TGX Stain-Free gels; representative bands from total proteins shown to indicate loading across samples). Bar graphs depict densitometry values of (B) porin and (C) Drp1 after normalizing to total protein bands and expressed as the percentage change from control means (100%) ±SEM. (D) Representative Western blot and (E) bar graph (percent change from control mean of 100% ±SEM) depicting levels of NDUFB8, a subunit of the electron-transport chain protein Complex I, in trained mice after normalizing to total protein (TP; Ponceau S staining). Student's t-test; n = 4–5; (*) P < 0.05.
Figure 8.
Figure 8.
Correlational analyses between Cr, memory, and protein levels. Pearson correlation coefficients between hippocampal Cr levels and (AC) MWM probe trial parameters and relative normalized densitometry values from western blot experiments measuring (DH) transcription factor, (IL) plasticity-related, and (MO) mitochondrial proteins in control (▪) and Cr-supplemented (▪) mice. n = 7–9, (*) P < 0.05; (**) P < 0.01.

Similar articles

Cited by

References

    1. Aksenov MY, Aksenova MV, Carney JM, Butterfield DA. 1997. Oxidative modification of glutamine synthetase by amyloid β peptide. Free Radic Res 27: 267–281. - PubMed
    1. Alberini CM, Kandel ER. 2014. The regulation of transcription in memory consolidation. Cold Spring Harb Perspect Biol 7: a021741. - PMC - PubMed
    1. Allahyar R, Akbar A, Iqbal F. 2015. Creatine monohydrate supplementation for 10 weeks mediates neuroprotection and improves learning/memory following neonatal hypoxia ischemia encephalopathy in female albino mice. Brain Res 1595: 92–100. - PubMed
    1. Allahyar R, Akbar A, Iqbal F. 2016. Effect of creatine monohydrate supplementation on learning, memory and neuromuscular coordination in female albino mice. Acta Neuropsychiatr 29: 27–34. - PubMed
    1. Allen PJ, D'Anci KE, Kanarek RB, Renshaw PF. 2010. Chronic creatine supplementation alters depression-like behavior in rodents in a sex-dependent manner. Neuropsychopharmacology 35: 534–546. - PMC - PubMed

Publication types

LinkOut - more resources