. 2018 Jan 16;9(1):235.
doi: 10.1038/s41467-017-02619-5.

Single-molecule FRET reveals multiscale chromatin dynamics modulated by HP1α

Affiliations

Single-molecule FRET reveals multiscale chromatin dynamics modulated by HP1α

Sinan Kilic et al. Nat Commun. .

Abstract

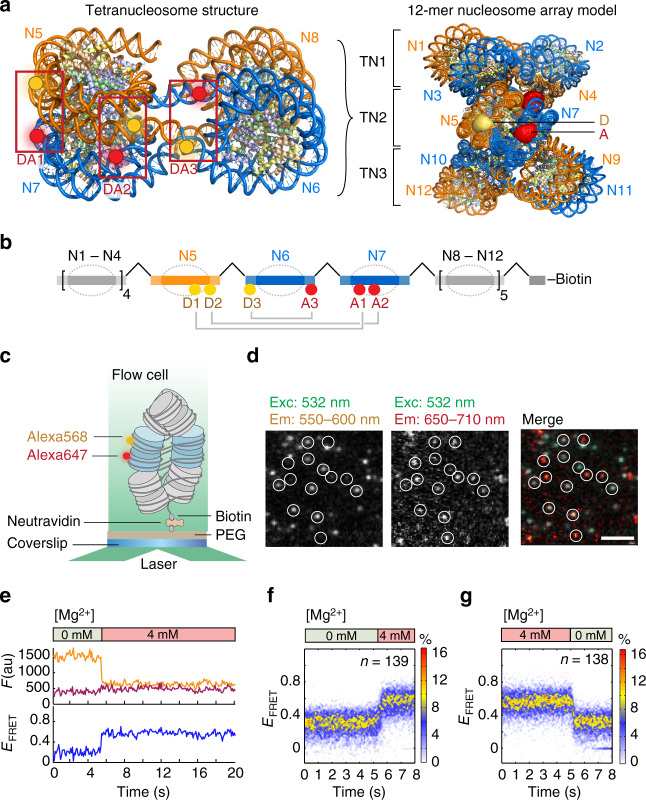
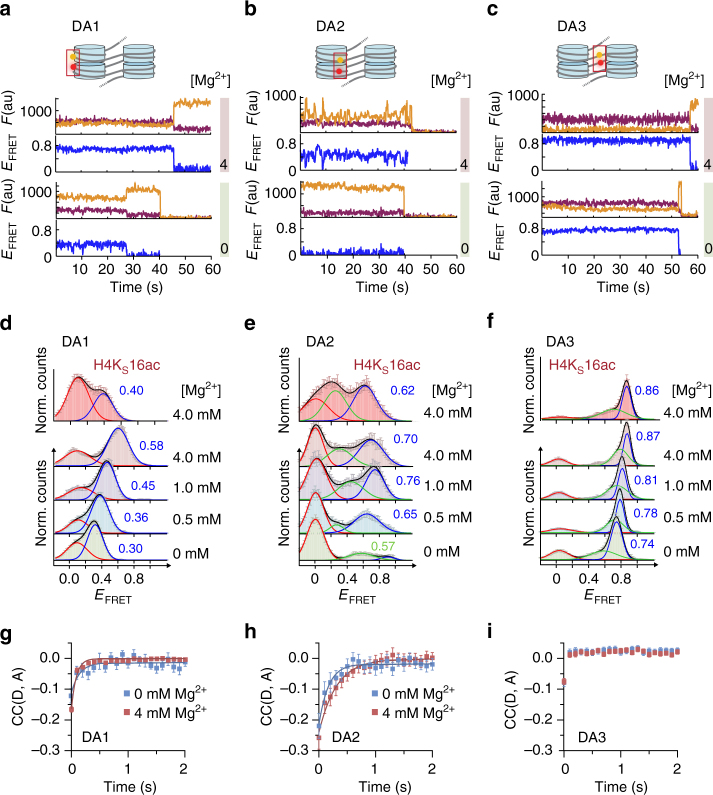
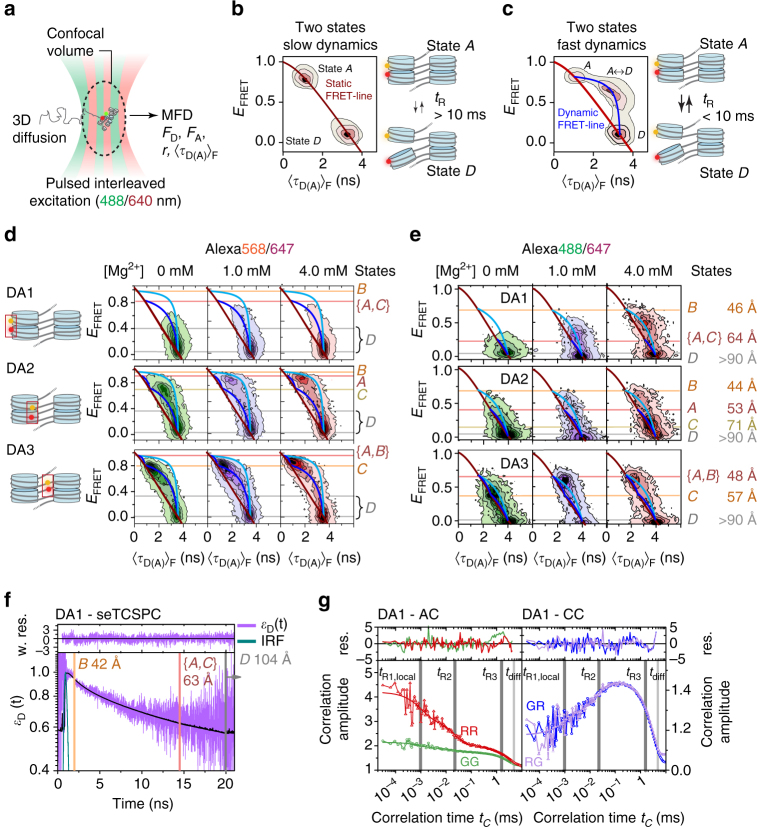
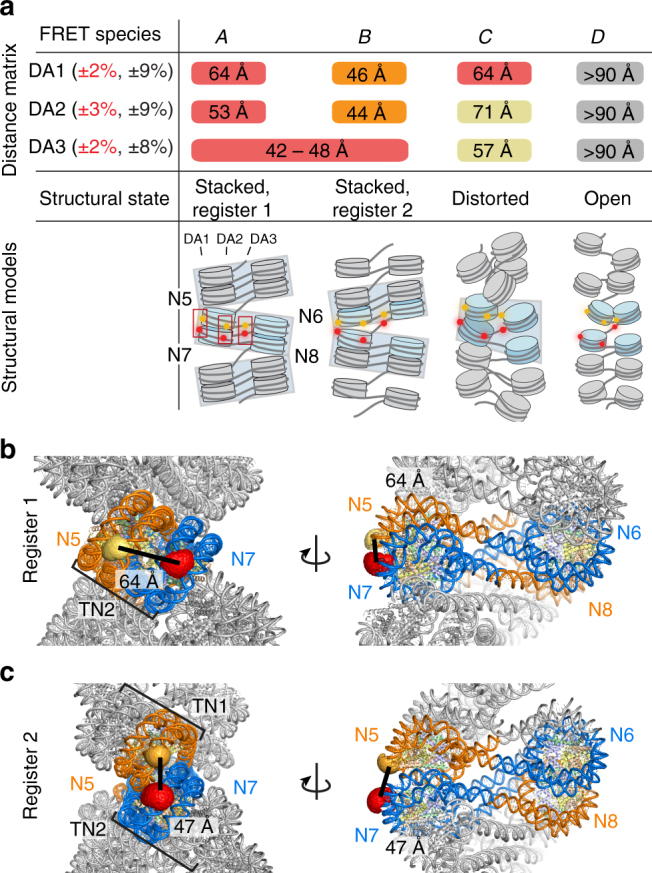
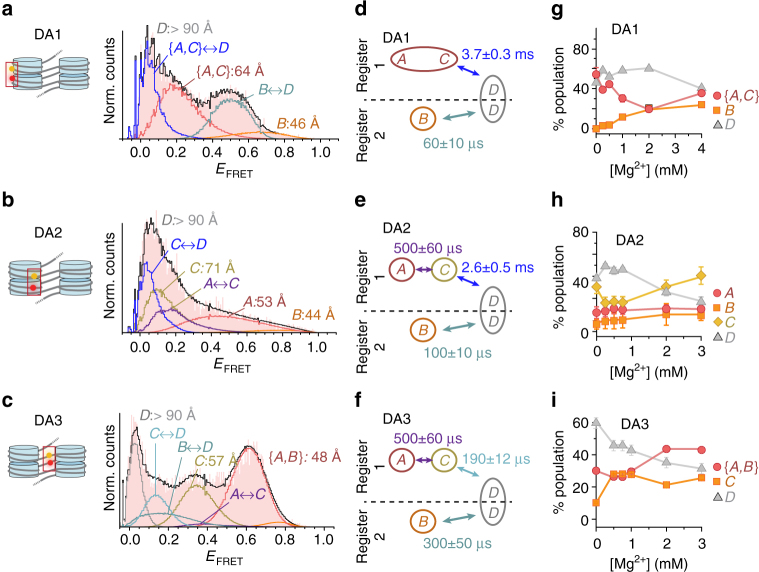
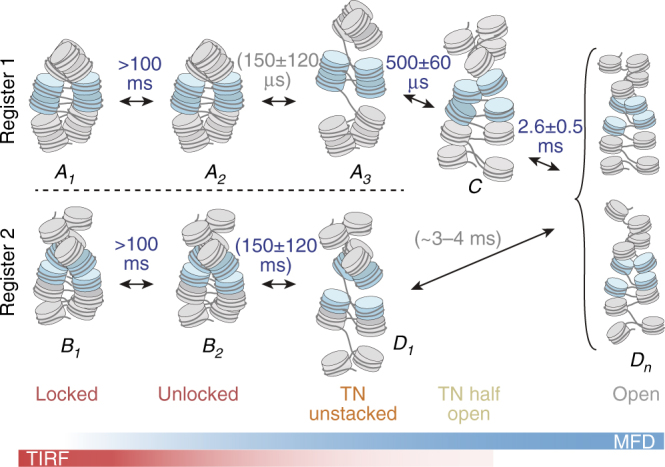
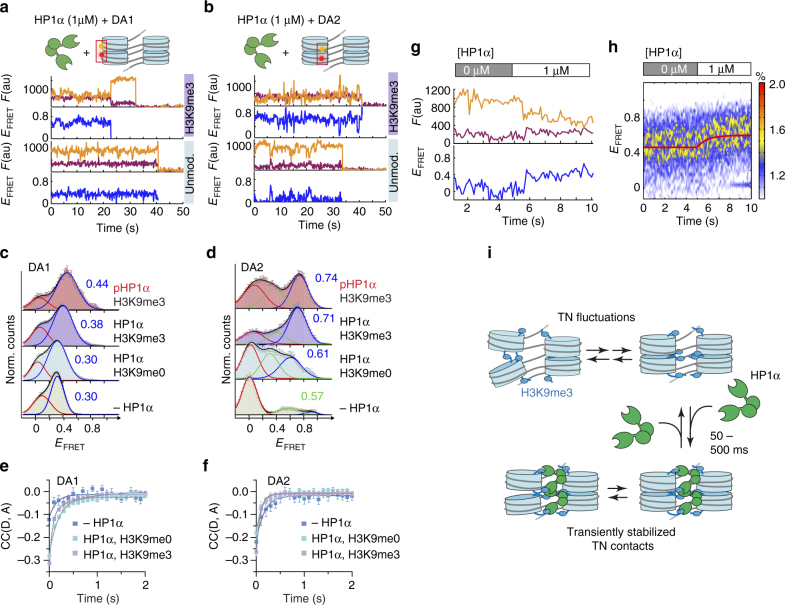
The dynamic architecture of chromatin fibers, a key determinant of genome regulation, is poorly understood. Here, we employ multimodal single-molecule Förster resonance energy transfer studies to reveal structural states and their interconversion kinetics in chromatin fibers. We show that nucleosomes engage in short-lived (micro- to milliseconds) stacking interactions with one of their neighbors. This results in discrete tetranucleosome units with distinct interaction registers that interconvert within hundreds of milliseconds. Additionally, we find that dynamic chromatin architecture is modulated by the multivalent architectural protein heterochromatin protein 1α (HP1α), which engages methylated histone tails and thereby transiently stabilizes stacked nucleosomes. This compacted state nevertheless remains dynamic, exhibiting fluctuations on the timescale of HP1α residence times. Overall, this study reveals that exposure of internal DNA sites and nucleosome surfaces in chromatin fibers is governed by an intrinsic dynamic hierarchy from micro- to milliseconds, allowing the gene regulation machinery to access compact chromatin.


Conflict of interest statement

The authors declare no competing financial interests.

Figures

Fig. 1
Fig. 1
smFRET system to detect real-time chromatin conformational dynamics. a Left: Tetranucleosome structure based on ref. showing the three dye pairs DA1, DA2, and DA3. Right: 12-mer chromatin fiber as a stack of three tetranucleosome (TN) units, modeled using the cryo-EM structure of a chromatin fiber. For exact dye positions, see Supplementary Fig. 1. The middle tetranucleosome carries the fluorescent labels, whose accessible volume is displayed. D donor, A acceptor labels, N nucleosomes. b Schematic view of the preparative DNA ligation used to introduce fluorescent labels. c Scheme of the TIRF experiment to measure intra-array smFRET. d Microscopic images showing FRET data of single chromatin arrays at 4 mM Mg2+, scale bar: 5 µm. e Trace from dynamic compaction of chromatin fibers by influx of 4 mM Mg2+. f DA1 chromatin fibers compact dynamically by influx of 4 mM Mg2+ at 5 s as reported by a rapid increase in FRET. Displayed: Overlay of indicated number of traces from single fibers. Only traces exhibiting a FRET change were included in the analysis (65%). g DA1 chromatin decompacts rapidly upon removal of Mg2+ by injection of low-salt buffer/EDTA. Only traces exhibiting a FRET change were included in the analysis (74%)
Fig. 2
Fig. 2
Multi-perspective smTIRF–FRET reveals dynamic chromatin compaction. a Single-molecule traces (donor: orange, acceptor: red, FRET: blue) for DA1 at 0 mM Mg2+ (bottom), 4 mM Mg2+ (top) until either donor or acceptor dye photobleaching. For analysis methods, see Supplementary Note, step 1 b FRET traces for DA2, same conditions as in a. c FRET traces for DA3, same conditions as in a. d FRET populations observed for DA1 at the indicated Mg2+ concentrations, as well as in the presence of H4KS16ac. e FRET populations for DA2, same conditions as in d. f FRET populations for DA3, same conditions as in d. df Error bars: s.e.m. For the number of traces, parameters of the Gaussian fits, see Supplementary Table 5. g Donor–acceptor channel cross-correlation analysis of DA1. Fits, 0 mM Mg2+: cross-correlation relaxation time tR = 140 ± 101 ms (n = 76); 4 mM Mg2+: tR = 73 ± 13 ms (n = 229). h Donor–acceptor channel cross-correlation analysis of DA2. Fits, 0 mM Mg2+: tR = 169 ± 79 ms (n = 61); 4 mM Mg2+: tR = 312 ± 108 ms (n = 52). i Donor–acceptor channel cross-correlation analysis of DA3. gi Error bars: s.e.m. For the number of traces, see Supplementary Table 5. Fit uncertainties correspond to 95% confidence intervals of a global fit of the indicated number of traces. For the percentage of dynamic traces, see Supplementary Table 6
Fig. 3
Fig. 3
Multiscale chromatin dynamics in two registers revealed by MFD. a Scheme of PIE-MFD: Species-averaged donor and acceptor emission intensities (FD, FA), intensity-averaged donor lifetime 〈τD(A)F and anisotropy (r) are simultaneously measured for each molecule diffusing through the confocal volume. b Principle of MFD analysis: If dynamics between two states A and D are slow (relaxation time tR ≫ 10 ms), distinct structural states are resolved by EFRET and 〈τD(A)F, falling on the static FRET line (red). c Fast dynamics (tR < 10 ms) result in an intermediate peak (labeled A ↔ D) on a dynamic FRET line (blue). Peak shape analysis reveals tR (Fig. 5). d 2D-MFD histograms for chromatin fibers DA1–3 (Alexa568/647) at indicated Mg2+ concentrations. These histograms contain contributions from donor-only labeled chromatin fibers. Red line: static FRET line. Dark and bright blue lines: Two dynamic FRET lines for the two tetranucleosome registers 1 and 2, indicating dynamic exchange with tR < 10 ms (for parameters of all FRET lines, see Supplementary Note, step 2). Red, orange, yellow, and gray lines: FRET species A–D (see also Fig. 4a). e 2D-MFD histograms for chromatin fibers DA1–3 labeled with Alexa488/647 at indicated Mg2+ concentrations. Red line: static FRET line; dark and bright blue lines: dynamic FRET lines. f Subensemble fluorescence lifetime analysis for DA1-labeled fibers (Alexa488/647) at 1 mM MgCl2 and EFRET>0.065. The FRET-induced donor decay εD(t) was fitted with contributions from FRET species {A, C}, B and D (for details and fit parameters of eqs. 3.1–6, see Supplementary Note, step 3), corresponding to the indicated inter-dye distances. IRF: instrument response function. g Auto- (left panel) and cross (right panel)-correlation functions of the donor (G) and acceptor (R) emission channels for the same subensemble as in f. Global analysis of FCS curves reveals FRET dynamics with two global structural relaxation times (tR2 = 27 µs (27%); tR3 = 3.1 ms (56 %)), a term describing local fluctuations (tR1,local = 2.6 µs (17%)) and an apparent diffusion time for all curves (tdiff = 4.96 ms) (for details and fit parameters of Eq. 4.1, see Supplementary Note, step 4)
Fig. 4
Fig. 4
Chromatin fibers exist in two rapidly interchanging tetranucleosome stacking registers. a Matrix of the inter-dye distances RDA for DA1, DA2, and DA3 obtained from dynPDA. Species that cannot be discriminated with a given FRET pair are labeled with the same color and/or a continuous box. Percentages given in brackets: uncertainties in the observed distances. Red: precision (ΔRDA(RDA)), relevant for relative RDA, calculated as s.d. between three PDA analyses of data sets comprising a fraction (70%) of all measured data (subsampling). Black: Absolute uncertainty, mainly determined by the uncertainty in R0 (Supplementary Note, step 9 and Supplementary Table 7). The combined average inter-dye distances RDA over DA1–3 allow us to map each FRET species to a class of corresponding structural states of chromatin (Supplementary Figs. 12 and 13, Supplementary Table 8, and Supplementary Note, steps 9 and 10). The registers of tetranucleosome units are indicated by light gray boxes. b Structural model of a chromatin array, consisting of a stack of three tetranucleosomes (register 1) with DA1-positioned dyes in the central tetranucleosome, based on ref. . The inter-dye distance was evaluated using simulated dye accessible contact volumes (ACV). c Molecular structure of a chromatin array, consisting of a stack of two tetranucleosomes, flanked by two unstacked nucleosomes at each side (register 2) with DA1-positioned dyes on the two central tetranucleosomes and inter-dye distance from ACV calculations. Molecular models for DA2 and DA3 are reported in Supplementary Figs. 12 and 13
Fig. 5
Fig. 5
Chromatin exhibits multiscale dynamics. ac dynPDA analysis of MFD data (for a detailed description, see Supplementary Note, steps 6–8). Red histogram: Experimental data, black line: PDA fit to the kinetic models corresponding to the indicated state connectivities (Fig. 5d–f). Gaussian distributions in orange hues or gray: Distributions corresponding to FRET states indicated in Fig. 4a: A (red), B (orange), C (yellow), and D (gray). Blue hues: Distributions originating from dynamic exchange between FRET species: A ↔ C (violet), C ↔ D (dark blue), B ↔ D (gray blue). a dynPDA analysis of MFD data for DA1 (at 4 mM Mg2+) using the kinetic connectivity outlined in Fig. 5d. b dynPDA analysis of MFD data for DA2 (at 3 mM Mg2+) using the kinetic connectivity outlined in Fig. 5e. c dynPDA analysis of MFD data for DA2 (at 3 mM Mg2+) using the kinetic connectivity outlined in Fig. 5f. df Kinetic connectivity maps for DA1–3 used for dynPDA, which describe the experimental data. Two dynamic equilibria (registers) are observed: Register 1 comprises species A, C, and D (as characterized by their inter-dye distance, RDA), exchanging with the indicated relaxation times. Register 2 comprises species B and D in equilibrium. Register exchange within D is not permitted in the model on the investigated timescales, as indicated by the dashed line. The indicated time constants are given for 2 mM Mg2+. For the individual rate constants, see Supplementary Figs. 16–18). Uncertainties: s.d. between three PDA analyses of data sets comprising a fraction (70%) of all measured data (subsampling). g Relative combined populations of observed species A–D for DA1 as a function of [Mg2+] (for the individual contributions of static and dynamic molecules, see Supplementary Figs. 16–18). h Relative combined populations for species A–D for DA2. (i) Relative combined populations for species A–D for DA3. For the full PDA fits, see Supplementary Figs. 16–18. Error bars: s.d. between three dynPDA analyses of data sets comprising a fraction (70%) of all measured data (subsampling). In some cases, the error bars are smaller than the symbol size
Fig. 6
Fig. 6
The dynamic register model of chromatin fiber dynamics (for details see text). The colored bars indicate the sensitivities of the two applied smFRET methods. The letters A, B, C, and D correspond to observed FRET species (Fig. 4a). Nucleosomes highlighted in blue are labeled and thus observed in the experiment. Numbered states correspond to different chromatin conformations, which exhibit the same FRET efficiency for DA1–3 but which can be kinetically differentiated. FRET species A includes conformational states {A1, A2, A3} for which stacked nucleosomes are observed. FRET species B includes all states {B1, B2} corresponding to observation across two neighboring tetranucleosome units. FRET species D (low-FRET states) includes locally unstacked nucleosomes (D1) and the ensemble of open fibers (Dn). Gray relaxation time constants are indirectly inferred; blue relaxation times are directly observed. The error ranges represent s.d. between observations of the same dynamic process with different FRET label pairs (for B2 ↔ D1), or directly from PDA subsampling (Fig. 5)
Fig. 7
Fig. 7
HP1α binding results in dynamically compacted chromatin. a FRET traces for DA1, containing no modification or H3K9me3 in the presence of 1 μM HP1α and the absence of Mg2+. b FRET trace for DA2, containing no modification or H3K9me3 in the presence of 1 μM HP1α. c FRET populations for DA1, showing H3K9me3-dependent compaction by HP1α and phosphorylated HP1α (pHP1α). d FRET populations for DA2, demonstrating close contacts induced by HP1α/pHP1α. c, d Error bars: s.e.m. For the number of traces, parameters of the Gaussian fits, see Supplementary Table 5. e Donor–acceptor channel cross-correlation analysis of DA1 in the presence of 1 μM HP1α. Fits, H3K9me0: tR,1 = 200 ± 25 ms (n = 530), H3K9me3: tR,1 = 64 ± 13 ms (72%), tR,2 = 640 ± 126 ms (28%) (n = 430). f Donor–acceptor channel cross-correlation analysis of DA2 in the presence of 1 μM HP1α. Fits, H3K9me0: tR = 123 ± 38 ms (n = 99); H3K9me3: tR,1 = 66 ± 16 ms (88%), tR,2 = 930 ± 543 ms (12%) (n = 106). Fit uncertainties correspond to 95% confidence intervals of a global fit of the indicated number of traces. For the percentage of dynamic traces, see Supplementary Table 6. e, f Error bars: s.e.m. For the number of traces, see Supplementary Table 5. g Stochastic compaction of chromatin induced by injection of HP1α at 5 s. h 2D histogram of multiple injections. Only traces exhibiting a FRET change were included in the analysis (42%). The fit yields a time constant of 1.1 ± 0.4 s (fit uncertainties correspond to 95% confidence intervals, global fit of n = 86 traces). i Model of transient stabilization of tetranucleosomes, which still retain some internal flexibility, by HP1α

References

    1. Luger K, Dechassa ML, Tremethick DJ. New insights into nucleosome and chromatin structure: an ordered state or a disordered affair? Nat. Rev. Mol. Cell Biol. 2012;13:436–447. doi: 10.1038/nrm3382. - DOI - PMC - PubMed
    1. Cuvier, O. & Fierz, B. Dynamic chromatin technologies: from individual molecules to epigenomic regulation in cells. Nat. Rev. Genet. 18, 457–472 (2017). - PubMed
    1. Bonev B, Cavalli G. Organization and function of the 3D genome. Nat. Rev. Genet. 2016;17:661–678. doi: 10.1038/nrg.2016.112. - DOI - PubMed
    1. Hsieh TH, et al. Mapping nucleosome resolution chromosome folding in yeast by micro-C. Cell. 2015;162:108–119. doi: 10.1016/j.cell.2015.05.048. - DOI - PMC - PubMed
    1. Risca VI, Denny SK, Straight AF, Greenleaf WJ. Variable chromatin structure revealed by in situ spatially correlated DNA cleavage mapping. Nature. 2017;541:237–241. doi: 10.1038/nature20781. - DOI - PMC - PubMed

Publication types

MeSH terms

LinkOut - more resources