Comparative Study
. 2018 Jan 16;8(1):805.
doi: 10.1038/s41598-017-18429-0.

Phenotype and Functional Features of Human Telomerase Reverse Transcriptase Immortalized Human Airway Smooth Muscle Cells from Asthmatic and Non-Asthmatic Donors

Affiliations
Comparative Study

Phenotype and Functional Features of Human Telomerase Reverse Transcriptase Immortalized Human Airway Smooth Muscle Cells from Asthmatic and Non-Asthmatic Donors

J K Burgess et al. Sci Rep. .

Abstract

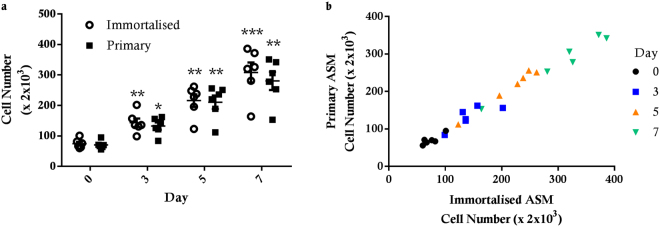
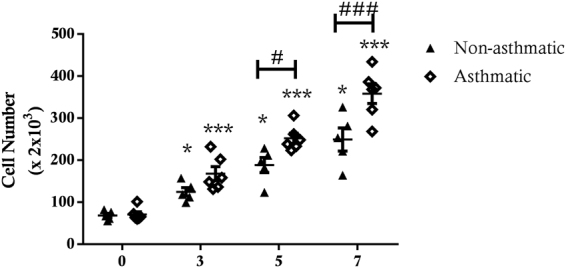
Asthma is an obstructive respiratory disease characterised by chronic inflammation with airway hyperresponsiveness. In asthmatic airways, there is an increase in airway smooth muscle (ASM) cell bulk, which differs from non-asthmatic ASM in characteristics. This study aimed to assess the usefulness of hTERT immortalisation of human ASM cells as a research tool. Specifically we compared proliferative capacity, inflammatory mediator release and extracellular matrix (ECM) production in hTERT immortalised and parent primary ASM cells from asthmatic and non-asthmatic donors. Our studies revealed no significant differences in proliferation, IL-6 and eotaxin-1 production, or CTGF synthesis between donor-matched parent and hTERT immortalised ASM cell lines. However, deposition of ECM proteins fibronectin and fibulin-1 was significantly lower in immortalised ASM cells compared to corresponding primary cells. Notably, previously reported differences in proliferation and inflammatory mediator release between asthmatic and non-asthmatic ASM cells were retained, but excessive ECM protein deposition in asthmatic ASM cells was lost in hTERT ASM cells. This study shows that hTERT immortalised ASM cells mirror primary ASM cells in proliferation and inflammatory profile characteristics. Moreover, we demonstrate both strengths and weaknesses of this immortalised cell model as a representation of primary ASM cells for future asthma pathophysiological research.


Conflict of interest statement

The authors declare that they have no competing interests.

Figures

Figure 1
Figure 1
Phase contrast micrographs of primary human ASM cell cultures and corresponding hTERT immortalized human ASM cell cultures generated from an asthma donor and non-asthma donor. Typical images from subconfluent and confluent cultures grown in culture media supplemented with FBS are shown. The primary cell culture shown was at Passage 1, and the hTERT cell line shown was imaged during Passage 5 after immortalization. The white scale bar shown = 50 µm.
Figure 2
Figure 2
Proliferative response of hTERT immortalised and primary ASM cells. hTERT immortalised ASM (n = 6) and primary ASM (n = 6) cells from the same donor were treated with 5% FBS for 7 days. Cell number was assessed by manual cell counting. (a) All data are presented as the mean +/− standard error of the mean (SEM). A two way ANOVA with Sidak’s multiple comparisons test was used to assess significance over time and compare immortalised and primary cells. Significance difference compared to previous count day *p < 0.05, **p < 0.01 and ***p < 0.001. (b) correlation of cell counts of primary and immortalised cells from the same donor.
Figure 3
Figure 3
IL-6 and eotaxin-1 production from hTERT immortalised and primary ASM cells. Comparison of IL-6 (a) and eotaxin-1 (b) production from hTERT immortalised (n = 6) and primary (n = 6) ASM cells from the same donors following 24 hour stimulation with 10 ng/ml IL-1β or 10 ng/ml TNF-α. All data are presented as the mean +/− SEM. Statistical analysis was performed using a two way ANOVA with Sidak’s multiple comparisons test for changes in IL-6 or eotaxin production due to treatment and comparison of immortalised and primary cells. Significance difference due to treatment *p < 0.05, **p < 0.01 and ***p < 0.001. Correlation of IL-6 (c) and eotaxin (d) release from primary and immortalised ASM cells from the same donor.
Figure 4
Figure 4
CTGF production from hTERT immortalised and primary ASM cells. Production of CTGF from hTERT immortalised (n = 6) and primary (n = 6) ASM cells following 24 hour treatment with 10 ng/ml TGF-β. (a) Data are presented as the mean +/− SEM of absorbance values (450 nm) in presence of CTGF Ab. A two way ANOVA with Sidak’s multiple comparisons test was used to detect differences between control and TGF-β treated groups and to compare immortalised ASM to primary ASM. Significant difference due to treatment *p < 0.05. (b) Correlation of CTGF production from primary and immortalised ASM cells from the same donor.
Figure 5
Figure 5
Fibronectin and fibulin-1 deposition by hTERT immortalised and primary ASM cells. FN and fibulin-1 deposition from hTERT immortalised (n = 6) and primary (n = 6) ASM cells in response to treatment with 10 ng/ml TGF-β. (a) FN and (b) fibulin-1 after 48 hours treatment and (c) FN and (d) fibulin-1 after 72 hours treatment with TGF-β. All data are presented as the mean +/− SEM. Statistical analysis performed using a two way ANOVA with Sidak’s multiple comparisons test for comparison of untreated to treated cells, to detect differences across time and also to detect significant differences between immortalised and primary cells. Significance between untreated and treated cells *p < 0.05 and **p < 0.01. Significance between immortalised and primary cells #p < 0.05, ##p < 0.01 and ###p < 0.001. Correlation of FN (e) and fibulin-1 (f) deposition after 72 hours treatment with TGFβ from primary and immortalised cells from the same donor.
Figure 6
Figure 6
Comparison of proliferation between immortalised ASM of asthmatic and non-asthmatic patients. hTERT immortalised nonasthmatic ASM (n = 5) and asthmatic ASM (n = 6) cells were treated with 5% FBS for 7 days. Cell number was assessed by manual cell counting. All data are presented as the mean +/− SEM with statistical analysis via a two way ANOVA with Sidak’s multiple comparisons test. Analysis was performed to detect differences between each count day and asthmatic and non-asthmatic ASM cell numbers. Significant cell number increase *p < 0.05 and ***p < 0.001. Significance between immortalised asthmatic and non-asthmatic cells #p < 0.05 and ###p < 0.001.
Figure 7
Figure 7
IL-6 and eotaxin-1 release from immortalised non-asthmatic and asthmatic ASM cells. (a) IL-6 and (b) eotaxin-1 release from ASM from immortalised non-asthmatic (n = 5) and asthmatic (n = 6) donors in response to 24 hour treatment with 10 ng/ml IL-1β or 10 ng/ml TNF-α. All data are presented as the mean +/− SEM. A two way ANOVA with Sidak’s multiple comparisons test was used to detect differences between asthmatic and non-asthmatic cells and treatment groups. Significance between asthmatic and non-asthmatic cells #p < 0.05, ##p < 0.01, ###p < 0.001. Significance difference induced by treatment compared to control **p < 0.01, ***p < 0.001.
Figure 8
Figure 8
CTGF production from immortalised asthmatic and non-asthmatic ASM cells. CTGF production from immortalised non-asthmatic (n = 5) and asthmatic (n = 6) ASM cells following 24 hour treatment with 10 ng/ml TGF-β. All data are presented as the mean +/− SEM with statistical analysis via a two way ANOVA with Sidak’s multiple comparisons test. Analysis was performed between control and treatment groups and immortalised asthmatic and non-asthmatic ASM cells. Significance between control and treatment **p < 0.01. Significance between immortalised asthmatic and non-asthmatic samples #p < 0.05.
Figure 9
Figure 9
Fibronectin and fibulin-1 deposition by immortalised asthmatic and non-asthmatic ASM cells. FN and FBLN-1 deposition from immortalised non-asthmatic (n = 5) and asthmatic (n = 6) ASM cells after 48 hrs (a and b respectively) or 72 hrs (c and d respectively) in response to treatment with 10 ng/ml TGF-β. All data are presented as the mean +/− SEM. Statistical analysis via a two way ANOVA with Sidak’s multiple comparisons test was performed to test differences between control and treatment groups and immortalised asthmatic and non-asthmatic ASM cells. Significance as a result of treatment is represented by **p < 0.01 and ***p < 0.001.

Similar articles

Cited by

References

    1. Woodruff PG, et al. Relationship between airway inflammation, hyperresponsiveness, and obstruction in asthma. Journal of Allergy and Clinical Immunology. 2001;108:753–758. doi: 10.1067/mai.2001.119411. - DOI - PubMed
    1. Slats AM, et al. Expression of smooth muscle and extracellular matrix proteins in relation to airway function in asthma. Journal of Allergy and Clinical Immunology. 2008;121:1196–1202. doi: 10.1016/j.jaci.2008.02.017. - DOI - PubMed
    1. Fixman ED, Stewart A, Martin JG. Basic mechanisms of development of airway structural changes in asthma. European Respiratory Journal. 2007;29:379–389. doi: 10.1183/09031936.00053506. - DOI - PubMed
    1. Pepe C, et al. Differences in airway remodeling between subjects with severe and moderate asthma. Journal of Allergy and Clinical Immunology. 2005;116:544–549. doi: 10.1016/j.jaci.2005.06.011. - DOI - PubMed
    1. Hershenson MB, Brown M, Camoretti-Mercado B, Solway J. Airway smooth muscle in asthma. Annual review of pathology. 2008;3:523–555. doi: 10.1146/annurev.pathmechdis.1.110304.100213. - DOI - PubMed

Publication types

LinkOut - more resources