. 2018 Jan 16;9(1):240.
doi: 10.1038/s41467-017-02759-8.

Dot1 regulates nucleosome dynamics by its inherent histone chaperone activity in yeast

Affiliations

Dot1 regulates nucleosome dynamics by its inherent histone chaperone activity in yeast

Soyun Lee et al. Nat Commun. .

Abstract

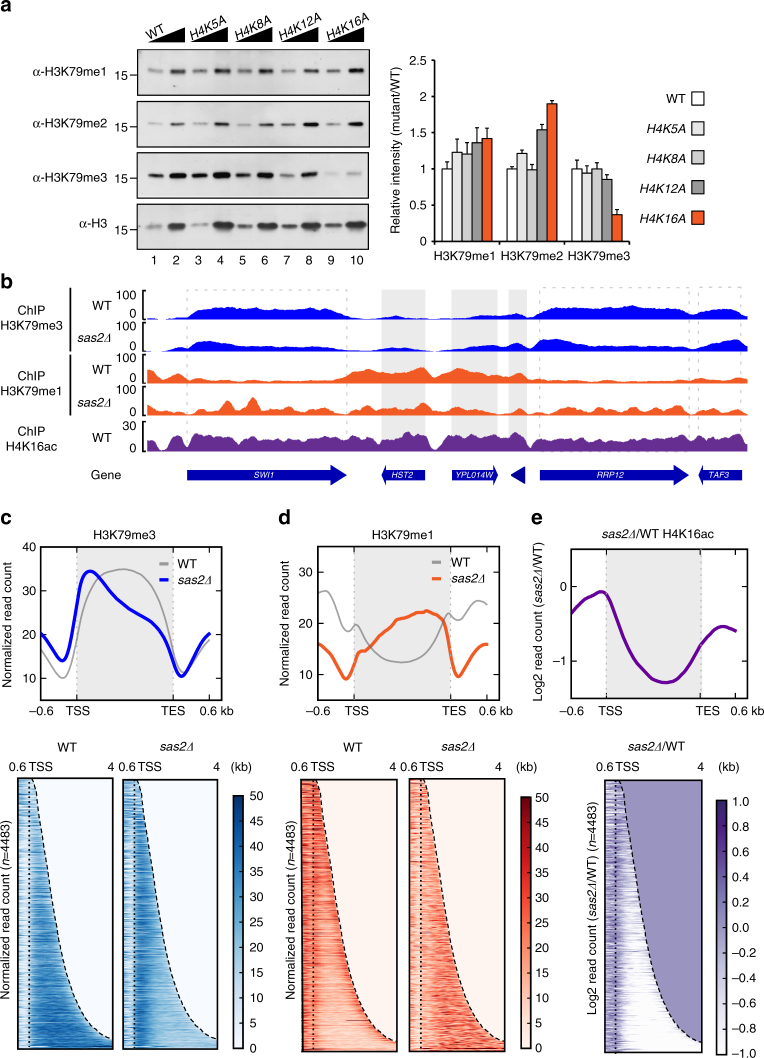
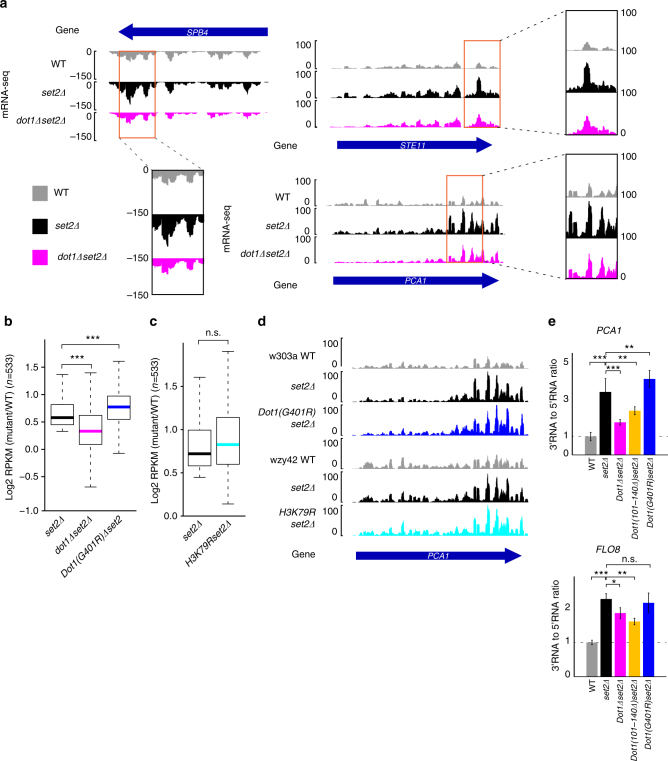
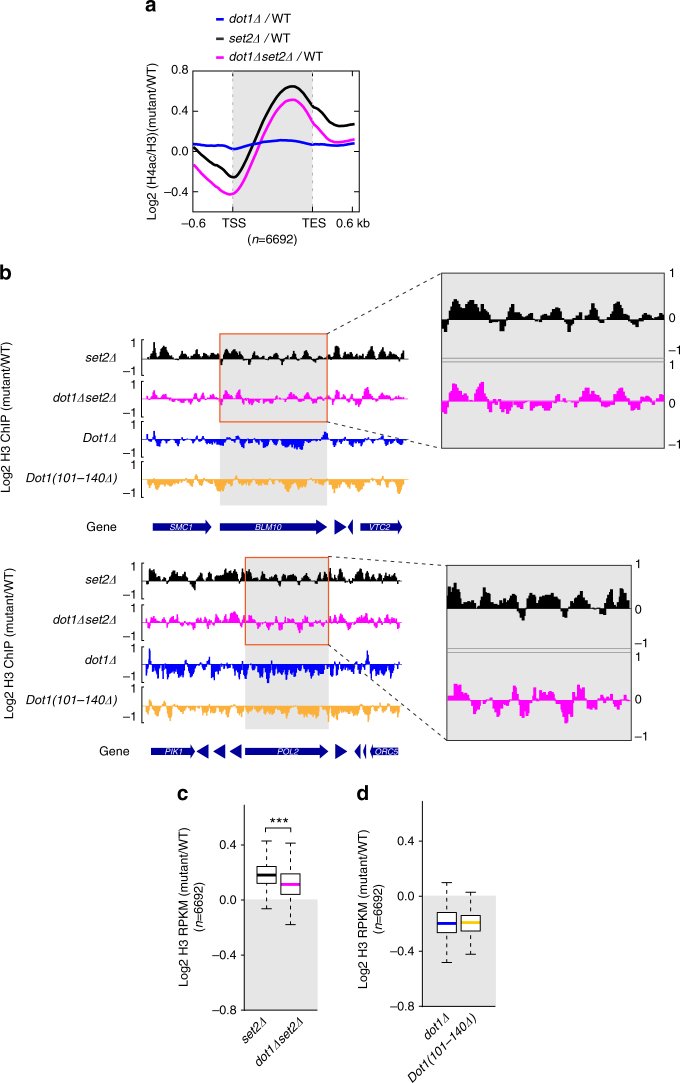
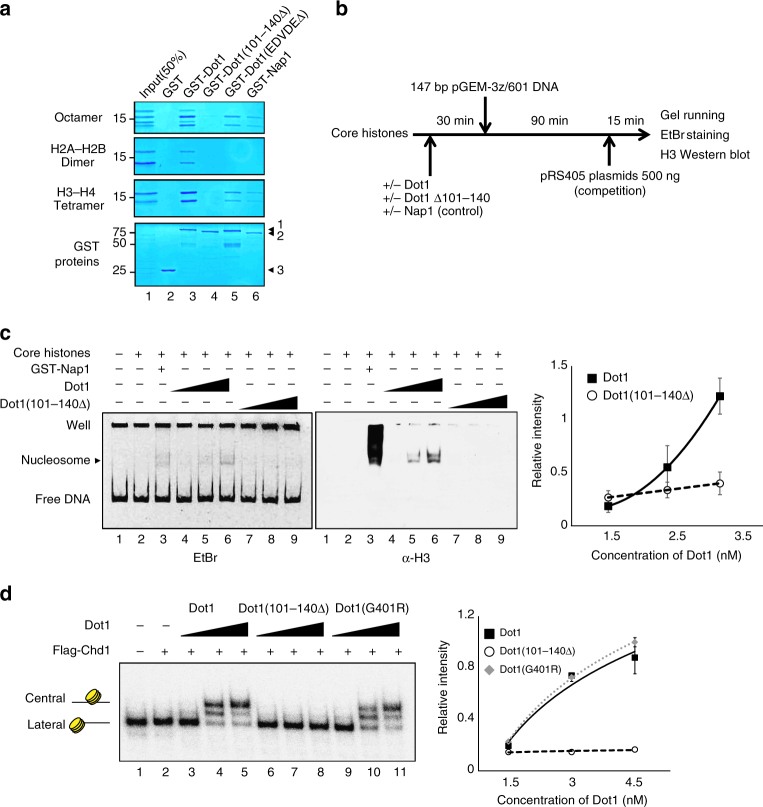
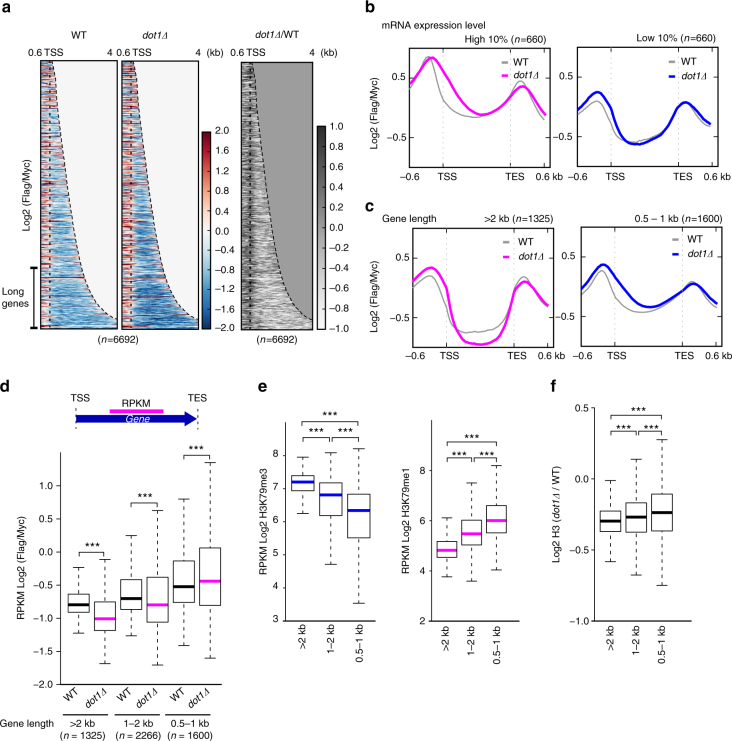
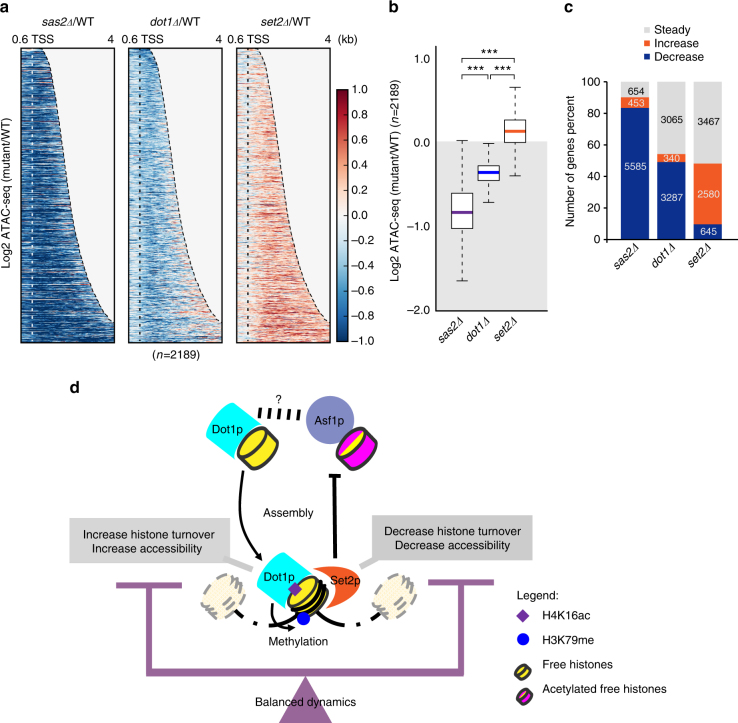
Dot1 (disruptor of telomeric silencing-1, DOT1L in humans) is the only known enzyme responsible for histone H3 lysine 79 methylation (H3K79me) and is evolutionarily conserved in most eukaryotes. Yeast Dot1p lacks a SET domain and does not methylate free histones and thus may have different actions with respect to other histone methyltransferases. Here we show that Dot1p displays histone chaperone activity and regulates nucleosome dynamics via histone exchange in yeast. We show that a methylation-independent function of Dot1p is required for the cryptic transcription within transcribed regions seen following disruption of the Set2-Rpd3S pathway. Dot1p can assemble core histones to nucleosomes and facilitate ATP-dependent chromatin-remodeling activity through its nucleosome-binding domain, in vitro. Global analysis indicates that Dot1p appears to be particularly important for histone exchange and chromatin accessibility on the transcribed regions of long-length genes. Our findings collectively suggest that Dot1p-mediated histone chaperone activity controls nucleosome dynamics in transcribed regions.


Conflict of interest statement

The authors declare no competing financial interests.

Figures

Fig. 1
Fig. 1
H4K16 acetylation regulates the Dot1p-mediated distribution of H3K79 methylation on euchromatin. a Western blot analysis for the levels of H3K79 mono-/di-/tri-methylation in histone lysine-to-alanine mutant strains. We used wzy42 strains of which the sequences of HHT1-HHF1 and HHT2-HHF2 genes are deleted, and maintained by the inserted plasmid pwz414-F13-HHT2-HHF2 to express histone H3 and H4. We modified the plasmid to express mutant histones H3 and H4. The right panel shows a quantification of the western blot data from three repeats. The error bars represent the s.d. for the biological replicates. b Distribution of H3K79me3 (blue) and H3K79me1 (orange) in wild-type and sas2Δ mutant cells. The values of the y-axis indicate normalized ChIP-seq read counts. The ChIP-seq data were obtained from biological duplicates. The distribution of H4K16ac in wild-type cells was indicated in purple. The dotted-line boxes indicate transcribed regions (SWI1, RRP12, and TAF3), while the gray boxes (HST2, CIP1, and MRPS16 (indicated as a triangle with no gene name label)) mark regions with low H3K79me3 levels. c, d Heatmaps and average plots showing the distributions of H3K79me3 (c, blue) and H3K79me1 (d, orange) in wild-type and sas2Δ mutant cells. e The H4K16ac level calculated as the log2 fold change in sas2Δ cells over wild-type cells (purple). The average plot and heatmap indicate differential distribution of H4K16ac on transcribed regions. Profiles are sorted by ascending length of their transcribed regions. ce The genes were sorted in descending order of their H3K79me3 levels on transcribed regions in sas2Δ cells (n = 4483). The read count data were obtained from biological duplicates. In the average plots, the values of the y-axis indicate normalized ChIP-seq read counts, and the x-axis indicate distance from transcription start sites (TSS) and transcription end sites (TES). For the heatmaps, the y-axis indicates each genes and the x-axis indicates distance from TSS. The genes in heatmap was arranged in order of length. The intensity of color indicates the value of normalized read counts from 0 to 50. The dotted lines indicate the TSS and TES. All values were normalized to the read count, and the value of the region exceeding the TES was treated as 0
Fig. 2
Fig. 2
Loss of DOT1 rescues the cryptic transcription of set2Δ cells in a methylation-independent manner. a mRNA-seq data in wild-type (gray), set2Δ (black), and dot1Δset2Δ (magenta) mutants for the cryptic loci, SPB4, STE11, and PCA1. The plus and minus values of the y-axis indicate level of mRNA read counts and the sense and antisense strands, respectively (left to right, +; right to left, −). The read count data were obtained from biological duplicates. The orange boxes indicate an enlarged view for peak of cryptic transcription in each loci. The values of zoom-up box represents y-axis values. b A boxplot of the log2 fold change values of set2Δ (black), dot1Δset2Δ (magenta), and Dot1(G401R)set2Δ (blue) mutants versus the levels in wild-type cells for genes that showed increased mRNA expression in set2Δ cells (n = 533). The Cuffdiff analysis program was used. The genes that passed the correction test in Cuffdiff were collected, and their fold change values versus wild-type levels were calculated. Data were obtained from biological duplicates. ***P-value <0.001. c A boxplot of the log2 fold change values for the set2Δ (black) and H3K79Rset2Δ (turquoise) histone residue modified mutants versus their wild-type strain (wzy42). Data were obtained from biological duplicates; n.s., p-value >0.05 (Wilcoxon and Mann–Whitney tests). d mRNA-seq data were obtained for Dot1 methylation activity-associated mutants using the cryptic gene, PCA1. set2Δ cells (color black) were used as a positive control. Dot1(G401R)set2Δ was based on the w303a wild-type (color blue, upper windows), while H3K79Rset2Δ was based on the wzy42 wild-type (color turquoise, lower windows). The values of the y-axis indicate level of mRNA read counts. e RT-qPCR analysis of cryptic transcription at the cryptic loci, FLO8 (upper) and PCA1 (bottom) from three biological repeats. The expression level of the 3′-end of each RNA was normalized by that of the corresponding 5′-end. The mutant values were normalized by that of the wild-type. The error bars represent the s.d. for the biological replicates. ***P-value <0.001; **p-value <0.01; *p-value <0.05; n.s., p-value >0.05 generated by analysis of variance (ANOVA) using the R statistic program. The levels of mRNA were quantified by quantitative PCR using the primers listed in Supplementary Table 3
Fig. 3
Fig. 3
Loss of DOT1 suppresses the increased histone exchange at transcribed regions in set2Δ cells. a The ChIP-seq average plot of H4ac normalized by H3. The values for set2Δ (black), dot1Δset2Δ (magenta), and dot1Δ (blue) cells were calculated as the log2 ratios of the mutant over wild type. The values of the y-axis indicate log2 fold change level of H4ac/H3 ChIP-seq in mutants over wild-type cells, and the x-axis indicates the distance from transcription start sites (TSS) and transcription end sites (TES). The data set included all transcribed regions of yeast (number of genes, n = 6692), and were obtained from biological duplicates. b Distribution of H3 at the BLM10 (left) and POL2 (right) genes. The ChIP-seq data were obtained from biological duplicates. The y-axis indicates log2 fold change of H3 in mutants over wild type. The H3 levels were normalized as log2 (mutant/wild-type) values using the spike-in normalization method. The plus and minus values of the y-axis indicate the increased and decreased level of each mutant with respect to wild type. The gray boxes indicate the transcribed regions of BLM10 and POL2. The orange boxes indicate an enlarged view for BLM10 and POL2 loci. The y-axis values represent the values of zoom-up box. c A boxplot of histone H3 log2 fold change values (normalized by the spike-in method). The y-axis indicates log2 fold change of H3 in mutants over wild type. The values presented for set2Δ (black) and dot1Δset2Δ (magenta) are relative to the wild-type values at the transcribed regions of all yeast genes (number of genes, n = 6692). The shadowed box indicates negative values, indicating the decreased region in mutant with respect to wild-type. ***P-value <0.001 (Wilcoxon and Mann–Whitney tests). d A boxplot of histone H3 log2 fold change values obtained for dot1Δ (blue) and Dot1(101–140Δ) (yellow) at the transcribed regions of all yeast genes (number of genes, n = 6692). The y-axis indicates log2 fold change of H3 in mutants over wild type. The shadowed box indicates negative values, indicating the decreased region in mutant with respect to wild type
Fig. 4
Fig. 4
Dot1p has nucleosome assembly activity and enhances chromatin remodeler activity. a Protein pull-down assay of GST-tagged Dot1 proteins against core histones. SDS-acrylamide gels were stained with Coomassie blue. The Octamer panel (top) indicates histone H2A, H2B, H3, and H4 for binding with GST (negative control), GST-Dot1, a nucleosome binding-defective mutant GST-Dot1 (101–140Δ), a histone H4 tail binding-defective mutant GST-Dot1(EDVDEΔ), and GST-Nap1 proteins. The H2A–H2B dimer (second panel) represents band size of histone H2A–H2B for each protein binding. The H3–H4 tetramer panel (third panel) indicates size of histone H3–H4 for each protein binding. The 5 μg of GST fusion proteins were incubated with 10 μg of histones in 200 μl of PDB buffer for 2 h at 4 °C. In the bottom panel, arrows indicate the following: 1, GST-Dot1p, GST-Dot1p (EDVDEΔ), and GST-Dot1p (101–140Δ) (showing a smaller size); 2, GST-Nap1p; and 3, GST. b Experimental scheme of the in vitro nucleosome assembly assay. c Assay of the ability of Dot1 to assemble nucleosomes on a fragment of pGEM-3z/601 DNA. The 147 bp DNA fragment (100 ng) was incubated without (lane 1) or with (lanes 2–9) 1:1 mass ratios of core histones. The nucleosome assembly activities of wild-type Dot1 (1.5, 2.4, and 3.2 nM; lanes 4–6) and the nucleosome binding-defective mutant, Dot1(101–140Δ) (same concentrations as Dot1; lanes 7–9) are shown, with 2 μg of GST-Nap1 used as a positive control for nucleosome assembly (lane 3). The arrow labeled with ‘nucleosome’ indicates size of assembled nucleosome. The nucleosome assembly was visualized with ethidium bromide (EtBr) staining (left) and histone H3 western blotting (center), and the data were quantified (right). The data are presented are averages of three experiments, and error bars represent the s.d. for the biological replicates. d The ability of Dot1 to stimulate chromatin remodeling does not require its methyltransferase activity. Sliding assays using the nucleosome remodeler, Chd1p, were performed with Dot1p (lanes 3–5), nucleosome binding-defective Dot1(101–140∆) (lanes 6–8), and methyltransferase activity-defective mutant Dot1 (G401R) (lanes 9–11). The graph (right) indicates the relative intensities of the central nucleosome bands versus the Dot1 protein concentration. The data presented are the averages of three experiments, and error bars represent the s.d. for the biological replicates
Fig. 5
Fig. 5
Dot1p preferentially affects histone exchange in long genes. a Heatmap of histone exchange (log2 Flag ChIP/Myc ChIP) at all genes of yeast (n = 6692). The read counts were obtained from biological duplicates. Profiles are shown in ascending order of the length of the transcribed region. Dotted lines indicate the TSS. Genes >2 kb in length are indicated as ‘Long Genes’. The value of the region exceeding the TES is treated as 0. Left, wild-type; center, dot1Δ; right, dot1Δ relative to wild type. The color bar represents value of log2 Flag/Myc (color red: >0, color blue: <0, for left and center panel; color black: >0, color white: <0, for right panel). b, c Total genes were clustered based on their b mRNA expression levels and c gene lengths. The gray line indicates the histone exchange rate in wild-type cells. Magenta lines indicate clusters of genes having high mRNA expression levels (b, n = 660) and those longer than 2 kb in length (c, n = 1325) in dot1∆ cells. Blue lines indicate clusters of genes having moderate mRNA expression levels (b, n = 660) and those of 0.5–1 kb in length (c, n = 1600). The values of the y-axis indicate histone exchange, and the x-axis indicate distance from TSS and TES. d, e ***P-value <0.001. The upper panel of (d) shows a schematic diagram of our analysis. Magenta colored line, the center of transcribed regions, represents the region where taken to be values in the boxplots in (d, e). d A boxplot of histone turnover RPKM values obtained at the centers of the transcribed regions in wild-type and dot1Δ cells for each gene length cluster (i.e., >2 kb, 1–2 kb, and 0.5–1 kb). e A boxplot of the RPKM values for H3K79me3 and H3K79me1 at the centers of transcribed regions. Genes are clustered based on gene length as described for (d), and the boxplots present H3K79me3 (left) and H3K79me1 (right). f The level of histone H3 is clearly related to gene length. A boxplot presents the log2 fold change of H3 in dot1Δ versus wild-type cells at the centers of transcribed regions, as normalized by gene length (RPKM)
Fig. 6
Fig. 6
Dot1p facilitates nucleosome accessibility in the transcribed region of genes. a Heatmap for the log2 fold change of the ATAC-seq signal in sas2Δ (left), dot1Δ (center), and set2Δ (right) cells versus wild type. Increased accessibility is indicated in red, and decreased accessibility is indicated in blue. Genes were ordered by their accessibility difference in dot1Δ versus wild-type cells (n = 2189). Data were obtained from biological duplicates. The y-axis indicates each genes and the x-axis indicates distance from TSS. The genes in heatmap was arranged in order of gene length. The color bar represents value of log2 mutant compared to wild-type (color red: >0, color blue: <0). The dotted lines indicate the TSS. All values were normalized to the read count, and the value of the region exceeding the TES was treated as 0. b A boxplot of ATAC signal log2 fold changes in mutants over wild type. The value of ATAC signal implies chromatin accessibility. The values of the y-axis indicate log2 fold change level of ATAC-seq value in each sas2Δ (purple), dot1Δ (blue), and set2Δ (orange) mutant over wild-type cells. ***P-value <0.001, calculated by Wilcoxon and Mann–Whitney tests, and the shadowed box represents negative values. c Stacked percent graph for the difference in accessibility between mutant and wild-type cells. Log2 fold changes between mutants (sas2Δ, dot1Δ, and set2Δ) and wild-type on transcribed regions were analyzed using Bwtool and the following classification criteria: increased (orange), log2 fold change >0.2; decrease (blue), log2 fold change <−0.2; steady (gray), −0.2 <log2 fold change <0.2. d The proposed model. Dot1p binds the nucleosome with the support of H4K16ac (purple diamond), and increases histone turnover and accessibility via its inherent histone chaperone activity (nucleosome binding). Conversely, Set2 acts to decrease histone turnover and accessibility, thereby balancing nucleosome dynamics. Dot1p methylates H3K79 by nucleosome binding (blue circle), but this activity is independent of its involvement in balancing nucleosome dynamics

Similar articles

Cited by

References

    1. Venkatesh S, et al. Set2 methylation of histone H3 lysine 36 suppresses histone exchange on transcribed genes. Nature. 2012;489:452–455. doi: 10.1038/nature11326. - DOI - PubMed
    1. Venkatesh S, Workman JL. Histone exchange, chromatin structure and the regulation of transcription. Nat. Rev. Mol. Cell Biol. 2015;16:178–189. doi: 10.1038/nrm3941. - DOI - PubMed
    1. Smolle M, Workman JL, Venkatesh S. reSETting chromatin during transcription elongation. Epigenetics. 2013;8:10–15. doi: 10.4161/epi.23333. - DOI - PMC - PubMed
    1. Li B, et al. Infrequently transcribed long genes depend on the Set2/Rpd3S pathway for accurate transcription. Genes Dev. 2007;21:1422–1430. doi: 10.1101/gad.1539307. - DOI - PMC - PubMed
    1. Carrozza MJ, et al. Histone H3 methylation by Set2 directs deacetylation of coding regions by Rpd3S to suppress spurious intragenic transcription. Cell. 2005;123:581–592. doi: 10.1016/j.cell.2005.10.023. - DOI - PubMed

Publication types

MeSH terms