Differential gene expression profiles between two subtypes of ischemic stroke with blood stasis syndromes
- PMID: 29340078
- PMCID: PMC5762346
- DOI: 10.18632/oncotarget.22877
Differential gene expression profiles between two subtypes of ischemic stroke with blood stasis syndromes
Abstract
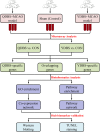
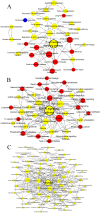
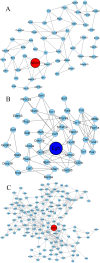
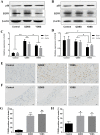
Ischemic stroke is a cerebrovascular thrombotic disease with high morbidity and mortality. Qi deficiency blood stasis (QDBS) and Yin deficiency blood stasis (YDBS) are the two major subtypes of ischemic stroke according to the theories of traditional Chinese medicine. This study was conducted to distinguish these two syndromes at transcriptomics level and explore the underlying mechanisms. Male rats were randomly divided into three groups: sham group, QDBS/MCAO group and YDBS/MCAO group. Morphological changes were assessed after 24 h of reperfusion. Microarray analysis with circulating mRNA was then performed to identify differential gene expression profile, gene ontology and pathway enrichment analyses were carried out to predict the gene function, gene co-expression and pathway networks were constructed to identify the hub biomarkers, which were further validated by western blotting and Tunel staining analysis. Three subsets of dysregulated genes were acquired, including 445 QDBS-specific genes, 490 YDBS-specific genes and 1676 blood stasis common genes. Our work reveals for the first time that T cell receptor, MAPK and apoptosis pathway were identified as the hub pathways based on the pathway networks, while Nfκb1, Egfr and Casp3 were recognized as the hub genes by co-expression networks. This research helps contribute to a clearer understanding of the pathological characteristics of ischemic stroke with QDBS and YDBS syndrome, the proposed biomarkers might provide insight into the accurate diagnose and proper treatment for ischemic stroke with blood stasis syndrome.
Keywords: blood stasis syndrome; ischemic stroke; network analysis; traditional Chinese medicine; transcriptomics.
Conflict of interest statement
CONFLICTS OF INTEREST The authors declare no conflicts of interest.
Figures


Similar articles
-
[Characteristics of traditional Chinese medicine syndromes in patients with acute ischemic stroke of yin or yang syndrome: a multicenter trial].Zhong Xi Yi Jie He Xue Bao. 2008 Apr;6(4):346-51. doi: 10.3736/jcim20080404. Zhong Xi Yi Jie He Xue Bao. 2008. PMID: 18405599 Chinese.
-
[Dynamic changes in traditional Chinese medicine syndromes in patients with ischemic stroke treated by acupuncture].Zhong Xi Yi Jie He Xue Bao. 2009 Apr;7(4):334-41. doi: 10.3736/jcim20090407. Zhong Xi Yi Jie He Xue Bao. 2009. PMID: 19361363 Chinese.
-
[Establishment of rat model of ischemic stroke with qi deficiency and blood stasis syndrome and its evaluation system].Zhongguo Zhong Xi Yi Jie He Za Zhi. 2009 Apr;29(4):343-6. Zhongguo Zhong Xi Yi Jie He Za Zhi. 2009. PMID: 19526762 Chinese.
-
[Biological essence of blood stasis-heat syndrome in ischemic stroke and current research status of traditional Chinese medicine prevention and treatment based on thromboinflammation reaction].Zhongguo Zhong Yao Za Zhi. 2024 Dec;49(23):6533-6540. doi: 10.19540/j.cnki.cjcmm.20240819.701. Zhongguo Zhong Yao Za Zhi. 2024. PMID: 39805799 Review. Chinese.
-
BuqiTongluo Granule for Ischemic Stroke, Stable Angina Pectoris, Diabetic Peripheral Neuropathy with Qi Deficiency and Blood Stasis Syndrome: Rationale and Novel Basket Design.Front Pharmacol. 2021 Oct 18;12:764669. doi: 10.3389/fphar.2021.764669. eCollection 2021. Front Pharmacol. 2021. PMID: 34733163 Free PMC article. Review.
Cited by
-
Silencing of TXNIP Alleviated Oxidative Stress Injury by Regulating MAPK-Nrf2 Axis in Ischemic Stroke.Neurochem Res. 2020 Feb;45(2):428-436. doi: 10.1007/s11064-019-02933-y. Epub 2019 Dec 19. Neurochem Res. 2020. PMID: 31858374
-
BuyangHuanwu Decoction attenuates cerebral vasospasm caused by subarachnoid hemorrhage in rats via PI3K/AKT/eNOS axis.Open Life Sci. 2022 Jul 13;17(1):735-743. doi: 10.1515/biol-2022-0071. eCollection 2022. Open Life Sci. 2022. PMID: 35891965 Free PMC article.
-
Differentially Expressed Genes and Their Clinical Significance in Ischaemic Stroke: An In-Silico Study.Malays J Med Sci. 2020 Dec;27(6):53-67. doi: 10.21315/mjms2020.27.6.6. Epub 2020 Dec 29. Malays J Med Sci. 2020. PMID: 33447134 Free PMC article.
-
The therapeutic role of Jingchuan tablet on ischaemic cerebral stroke via the HIF-1α/EPO/VEGFA signalling pathway.Pharm Biol. 2022 Dec;60(1):2110-2123. doi: 10.1080/13880209.2022.2134430. Pharm Biol. 2022. PMID: 36269045 Free PMC article.
References
-
- Gu N, Dong Y, Tian Y, Di Z, Liu Z, Chang M, Jia X, Qian Y, Zhang W. Anti-apoptotic and angiogenic effects of intelectin-1 in rat cerebral ischemia. Brain Res Bull. 2016;130:27–35. - PubMed
-
- Mozaffarian D, Benjamin EJ, Go AS, Arnett DK, Blaha MJ, Cushman M, Das SR, de Ferranti S, Després J, Fullerton HJ, Howard VJ, Huffman MD, Isasi CR, et al. Executive Summary: Heart Disease and Stroke Statistics—2016 Update. Circulation. 2016;133:447–454. - PubMed
-
- Wahlgren N, Ahmed N, Davalos A, Hacke W, Millan M, Muir K, Roine RO, Toni D, Lees KR. Thrombolysis with alteplase 3-4.5 h after acute ischaemic stroke (SITS-ISTR): an observational study. Lancet. 2008;372:1303–1309. - PubMed
-
- Xiong L, Hu M, Zhang X, Jing Z, Li T, Li G, Liu J, Yu Y, Meng F, Wang Z. Association between Glu298Asp/677C-T single nucleotide polymorphism in the eNOS/MTHRF gene and blood stasis syndrome of ischemic stroke. Gene. 2012;511:475–479. - PubMed
LinkOut - more resources
Full Text Sources
Other Literature Sources
Molecular Biology Databases
Research Materials
Miscellaneous

