Review
. 2018 Jan 17;9(1):8.
doi: 10.3390/jfb9010008.

DNA-Based Single-Molecule Electronics: From Concept to Function

Affiliations
Review

DNA-Based Single-Molecule Electronics: From Concept to Function

Kun Wang. J Funct Biomater. .

Abstract

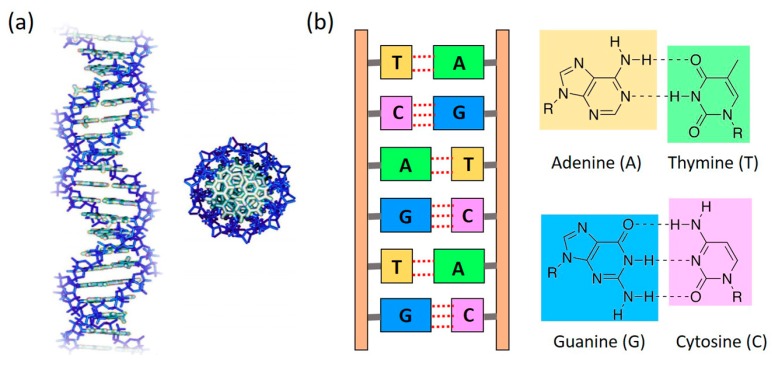
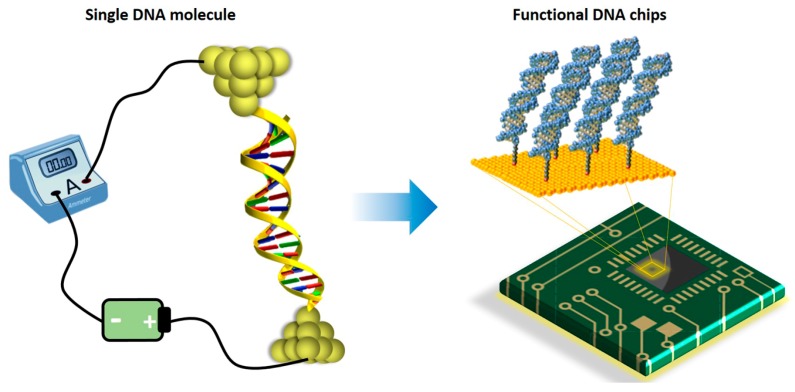
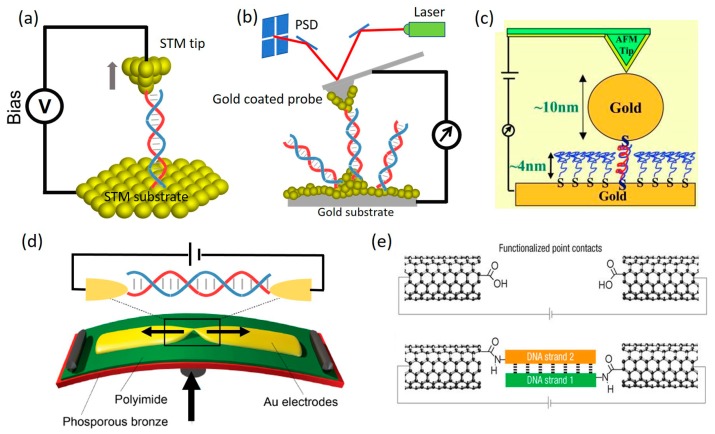
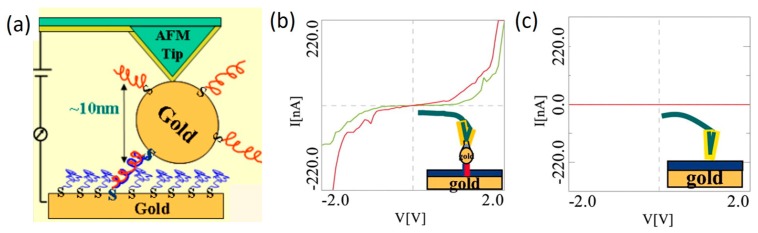
Beyond being the repository of genetic information, DNA is playing an increasingly important role as a building block for molecular electronics. Its inherent structural and molecular recognition properties render it a leading candidate for molecular electronics applications. The structural stability, diversity and programmability of DNA provide overwhelming freedom for the design and fabrication of molecular-scale devices. In the past two decades DNA has therefore attracted inordinate amounts of attention in molecular electronics. This review gives a brief survey of recent experimental progress in DNA-based single-molecule electronics with special focus on single-molecule conductance and I-V characteristics of individual DNA molecules. Existing challenges and exciting future opportunities are also discussed.

Keywords: DNA; I–V characteristics; charge transport; molecular electronics; molecular junctions; single-molecule conductance.


Conflict of interest statement

The author declares no conflict of interest.

Figures

Figure 1
Figure 1
(a) Schematic representation of a double helix DNA from side view (left) and top view (right); (b) DNA base pair (bp) coupling between Adenine (A)—Thymine (T) via two hydrogen bonds (dotted lines) and Guanine (G)—Cytosine (C) via three hydrogen bonds (dotted lines).
Figure 2
Figure 2
Vision from DNA single-molecule junction to future DNA-based molecular chips.
Figure 3
Figure 3
Single-molecule break-junction techniques (SMBJs). (a) Scanning tunneling microscope break-junction (STM-BJ) technique; (b) Conductive probe atomic force microscope break-junction (CPAFM-BJ) technique; (c) CPAFM-BJ involving nanoparticle capped DNA molecule. Reprinted with permission from ref. [51]. Copyright (2005) National Academy of Sciences, USA; (d) Mechanically controlled break-junction (MCBJ) technique; (e) SWCNT-molecule-SWCNT molecular junction. Reprinted with permission from ref. [13]. Copyright (2008) from Nature publishing group.
Figure 4
Figure 4
(a) Schematic of CPAFM-based method with a nanoparticle capped DNA molecule sandwiched between AFM tip and substrate; (b) Measured I–V curves of double strand DNA was performed on a metal particle without pressing on it; (c) I–V curve measured on the ssDNA monolayer without pressing it. Negligible current was observed here, indicating that the ssDNA monolayer is insulating. Reprinted with permission from ref. [51]. Copyright (2005) National Academy of Science, USA.
Figure 5
Figure 5
Effect of mismatched base pair on DNA conductance. (a) Mismatched DNA sequences studied in the work by Hihath et al.; (b) Measured single-molecule conductance of DNA molecules presented in (a). Reprinted with permission from ref. [69]. Copyright (2005) National Academy of Science, USA.
Figure 6
Figure 6
Measurement of charge transfer rate by Giese et al.: log(PGGG/PG) against the number n of the A:T base pairs The steep line corresponds to the coherent tunneling charge transfer. Reprinted with permission from ref. [76]. Copyright (2001) Nature Publishing Group.
Figure 7
Figure 7
Sequence and length dependent conductance (G) of single DNA molecules. Panel (a,b) show the example conductance histogram and conductance vs. distance traces, respectively; (c) ln(G/G0) vs. molecular length plot for DNA with ACGC(AT)mGCGT sequences; (d) G vs. 1/length plot for DNA with (GC)n sequences; (e) Resistance of A(CG)nT DNA as a function of number of base pairs; (f) Log R vs. number of base pair plot for DNA with ACGC(AT)mGCGT/ACGC(AT)mAGCGT sequences. (ad) are reprinted with permission from ref. [47]. Copyright (2004) American Chemical Society. (ef) are reprinted with permission from ref. [77]. Copyright (2016) Nature Publishing Group.
Figure 8
Figure 8
Single-molecule conductance measurements of DNA with alternating G (A(CG)nT) and stacked G (ACnGnT) sequences. Reprinted with permission from ref. [72]. Copyright (2015) Nature Publishing Group.
Figure 9
Figure 9
Conductance measurements of poly(GC)4 DNA under a structural transition from B- to Z-form. (a) Schematic of STM-BJ method; (b) Example conductance histograms and traces of B-DNA (upper) and Z-DNA (lower) in 1 M MgCl2 solution; (c) CD spectra measured in 0–2 M MgCl2 solutions; (d) Transition degree vs. log MgCl2 concentration plot, showing the entire transition process monitored by conductance measurement. Reprinted with permission from ref. [79]. Copyright (2014) Royal Society of Chemistry.
Figure 10
Figure 10
Conductance measurements of DNA under B-A structural transition (a) Schematic of B- and A-DNA molecular junction; (b) Example conductance traces of B-DNA (blue) and A-DNA (green); (c) Example conductance histograms of B-DNA (blue) and A-DNA (green); (d) CD spectra of B-DNA (blue) and A-DNA (green) sample. Reprinted with permission from ref. [89]. Copyright (2015) Nature Publishing Group.
Figure 11
Figure 11
Stretching effect of DNA conductance. (a) Illustration of the evolution of dsDNA duplex during stretching; (b) Example conductance trace for dsDNA sequence 5′-S(CG)2T-3′; (c) Resistance vs. molecular length plot; (d) Stretching length vs. molecular length plot. Reprinted with permission from ref. [98]. Copyright (2015) American Chemical Society.
Figure 12
Figure 12
(a) biotin-avidin (BA)–G4-DNA scheme showing an oriented ordered stack of tetrads and AFM image showing a typical measurement scenario: a gold electrode with a sharp edge is on the left and molecules are clearly visible on the mica to the right; one molecule (at the bottom) is protruding from under the edge of the metal electrode; (b) I–V measurements taken at the positions indicated by colored dots on the molecule shown in (a); (c) Distance dependence of the current measured at a bias of 5 V for three different molecules (plotted in different colors). Reprinted with permission from ref. [102]. Copyright (2014) Nature Publishing Group.
Figure 13
Figure 13
(a) Schematic illustration of G4-DNA measured by MCBJ setup; (b) I–V curves measured at different at different stages of G4-DNA defolding. (a,b) are reprinted with permission from ref. [104] Copyright (2010) Wiley–VCH Verlag GmbH & Co., KGaA. (c) Schematic representation of the CNT-G4-DNA-CNT sensing setup for protein detection; (d) Current vs. gate voltage curves measured at a constant source-drain voltage of −15 mV before and after thrombin treatments, showing reversible current change at two discrete levels; (c,d) are reprinted with permission from ref. [109]. Copyright (2011) Wiley–VCH Verlag GmbH & Co. KGaA.
Figure 14
Figure 14
(a) Structure of a DNA oligomer with sequences of GGGG and mCmCmCmC; (b) Current signal (upper) and histogram (lower) of the DNA. (a,b) are reprinted with permission from ref. [110]. Copyright (2011) American Chemical Society (c) Left: DNA sequence and structure of cytosine and 5-methylcytosine; Right: conductance histograms for native DNA (grey) and methylated DNA (black). (Reprinted with permission from ref. [111]. Copyright (2012) IOP Publishing.
Figure 15
Figure 15
(a) The molecular structure of Cu2+ mediated base pair; (b) Components of metallo-DNA-bridged SWCNT devices; (c) Current vs. gate voltage signals of a device reconnected with metallo-DNA (blue); (d) Current vs. gate voltage under periodic treatment of Cu2+ and EDTA. Reprinted with permission from ref. [112]. Copyright (2011) Wiley–VCH Verlag GmbH & Co. KGaA.
Figure 16
Figure 16
(a) Sequence of dsDNA, structure of coralyne molecule and their interaction revealed by UV-vis spectra. Reprinted with permission from ref. [9]. Copyright (2016) Nature Publishing Group. (b) Conductance measurements of dsDNA molecules with EB and HOE intercalated between the base pairs and into the grooves, respectively. Reprinted with permission from ref. [113]. Copyright (2017) Royal Society of Chemistry.
Figure 17
Figure 17
Demonstration of first DNA-based molecular diode. (a) STM-BJ setup; (b) Schematic of DNA-coralyne complex molecular junction; (c,d) show the I–V curves and rectification ratio curves of native DNA (blue) and DNA-coralyne complex (red); (e) Transmission function of DNA-coralyne complex molecular junction under different biases; (f) Transmission function of HOMO (solid lines) and HOMO-1 (dashed lines) levels of DNA-coralyne complex molecular junction under 1.1 V and −1.1 V. Reprinted with permission from ref. [9]. Copyright (2016) Nature Publishing Group.
Figure 18
Figure 18
(a) Illustration of the STM-BJ-based electrochemical (EC) gating setup; (b) Redox modified DNA (Aq-DNA), where a base was replaced with an anthraquinone (Aq) moiety (highlighted in blue) at the 3′ end of a DNA strand; (c) Conductance histograms of Aq-DNA with the gate voltage set above (0.085 V in I), at (−0.002 V in II) and below (−0.078 V in III) the redox potential; (d) Conductance values at different gate voltages showing two discrete conductance states. Reprinted with permission from ref. [130]. Copyright (2017) Nature Publishing Group.
Figure 19
Figure 19
(a) CAFM-BJ setup for spin-dependent CT in DNA; (b) I–V curves of DNA with different lengths measured under two magnetic field polarities (up: red and down: blue); (c) Estimated effective barrier for DNA with different lengths. Reprinted with permission from ref. [134]. Copyright (2011) American Chemical Society.
Figure 20
Figure 20
(a) Schematic diagram of STM-BJ with a modulating tip; (b) Upper: low-frequency component of the current collected from the single DNA junction; lower: the piezoresistance (α) in DNA (red curve) and conductance modulation due to tip modulation (blue curve); (c) α vs. conductance histogram for G-C sequence; α vs. molecular length for (d) (G–C)N and (e) (GN–CN) sequences, respectively. Reprinted with permission from ref. [138]. Copyright (2015) Nature Publishing Group.
Figure 21
Figure 21
(a) Illustration of a DNA molecule bridged between STM tip (kept at 295 K) and substrate (cold); (b) The measured Seebeck coefficient (S) of DNA molecules with different sequences and lengths. Reprinted with permission from ref. [77]. Copyright (2016) Nature Publishing Group.
Figure 22
Figure 22
Possible routes to develop future integrated DNA circuits by combining DNA origami technologies (upper row) and appropriate modifications of the electronic structure of individual DNA molecule (lower row). The middle frame of the upper row is reprinted with permission from ref. [34]. Copyright (2017) Nature Publishing Group. The right frame of the upper row is reprinted with permission from ref. [143]. Copyright (2017) Nature Publishing Group. The middle and right frames of the lower row are reprinted with permission from ref. [116]. Copyright (2010) ELSEVIER.

References

    1. Aviram A., Ratner M.A. Molecular rectifiers. Chem. Phys. Lett. 1974;29:277–283. doi: 10.1016/0009-2614(74)85031-1. - DOI
    1. Ratner M. A brief history of molecular electronics. Nat. Nanotechnol. 2013;8:378–381. doi: 10.1038/nnano.2013.110. - DOI - PubMed
    1. Reed M.A., Zhou C., Muller C.J., Burgin T.P., Tour J.M. Conductance of a molecular junction. Science. 1997;278:252–254. doi: 10.1126/science.278.5336.252. - DOI
    1. Xu B.Q., Tao N.J. Measurement of single-molecule resistance by repeated formation of molecular junctions. Science. 2003;301:1221–1223. doi: 10.1126/science.1087481. - DOI - PubMed
    1. Di Ventra M., Pantelides S.T., Lang N.D. First-principles calculation of transport properties of a molecular device. Phys. Rev. Lett. 2000;84:979–982. doi: 10.1103/PhysRevLett.84.979. - DOI - PubMed

LinkOut - more resources