. 2018 Jan 25;553(7689):511-514.
doi: 10.1038/nature25186. Epub 2018 Jan 17.

Clonal evolution mechanisms in NT5C2 mutant-relapsed acute lymphoblastic leukaemia

Affiliations

Clonal evolution mechanisms in NT5C2 mutant-relapsed acute lymphoblastic leukaemia

Gannie Tzoneva et al. Nature. .

Abstract

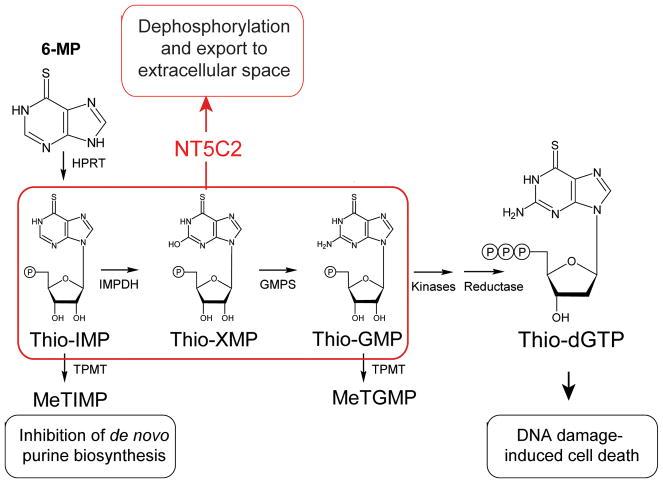
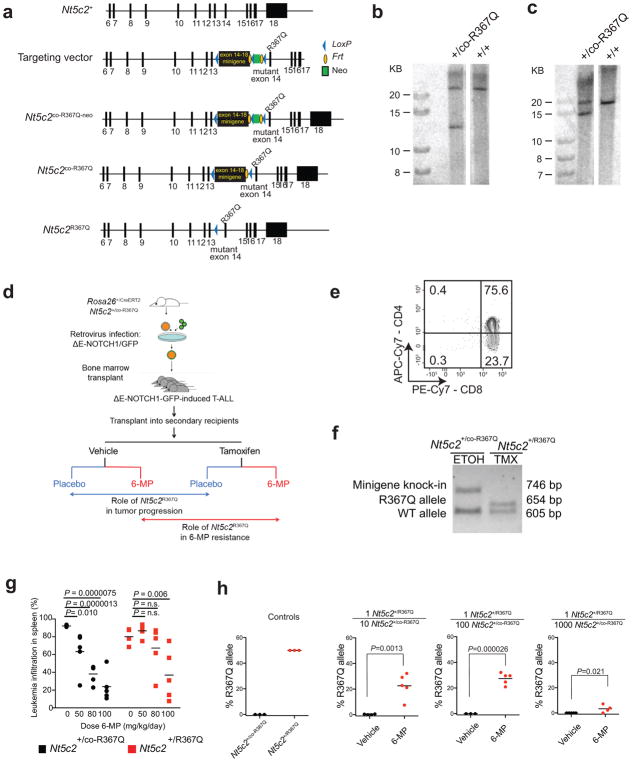
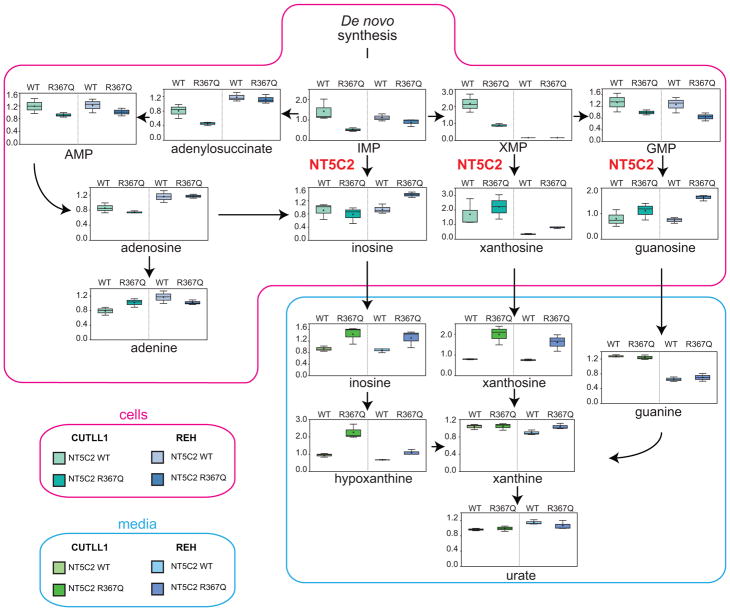
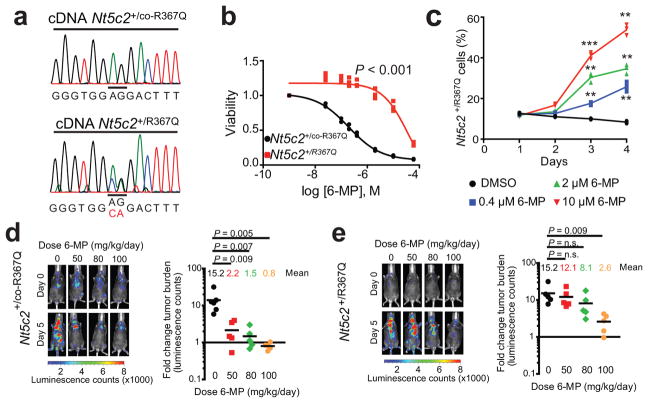
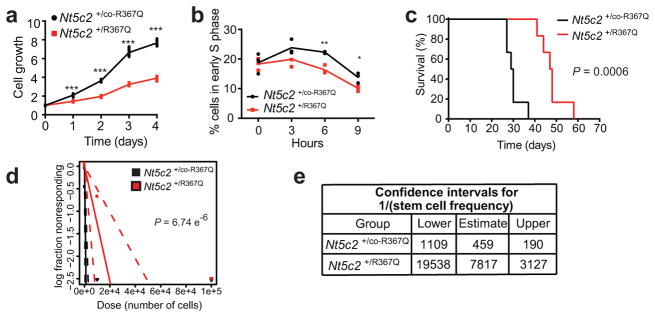
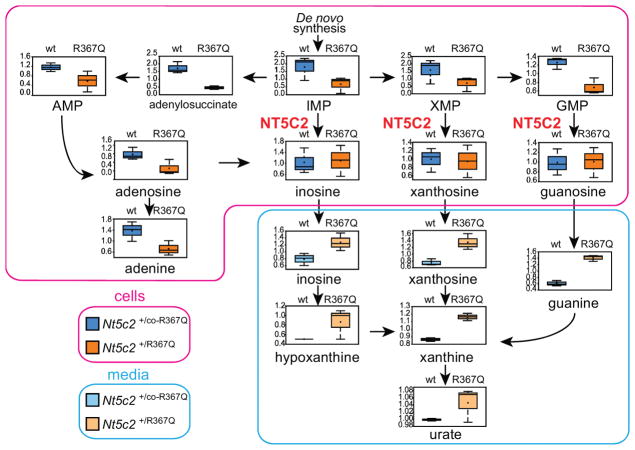
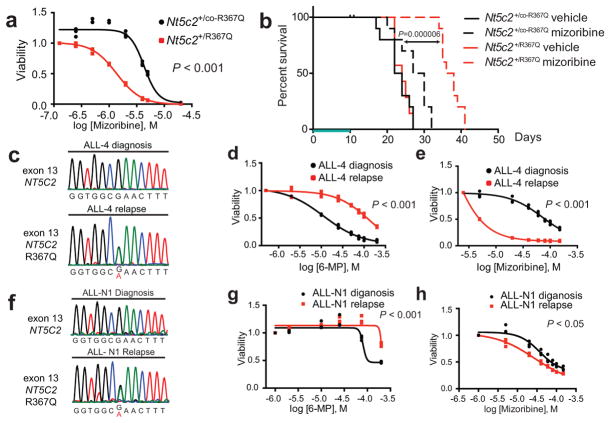
Relapsed acute lymphoblastic leukaemia (ALL) is associated with resistance to chemotherapy and poor prognosis. Gain-of-function mutations in the 5'-nucleotidase, cytosolic II (NT5C2) gene induce resistance to 6-mercaptopurine and are selectively present in relapsed ALL. Yet, the mechanisms involved in NT5C2 mutation-driven clonal evolution during the initiation of leukaemia, disease progression and relapse remain unknown. Here we use a conditional-and-inducible leukaemia model to demonstrate that expression of NT5C2(R367Q), a highly prevalent relapsed-ALL NT5C2 mutation, induces resistance to chemotherapy with 6-mercaptopurine at the cost of impaired leukaemia cell growth and leukaemia-initiating cell activity. The loss-of-fitness phenotype of NT5C2+/R367Q mutant cells is associated with excess export of purines to the extracellular space and depletion of the intracellular purine-nucleotide pool. Consequently, blocking guanosine synthesis by inhibition of inosine-5'-monophosphate dehydrogenase (IMPDH) induced increased cytotoxicity against NT5C2-mutant leukaemia lymphoblasts. These results identify the fitness cost of NT5C2 mutation and resistance to chemotherapy as key evolutionary drivers that shape clonal evolution in relapsed ALL and support a role for IMPDH inhibition in the treatment of ALL.


Conflict of interest statement

The authors declare no competing financial interests.

Figures

Extended Data Figure 1
Extended Data Figure 1. Schematic representation of 6-MP activation and mechanism of action
The hypoxanthine-guanine phosphoribosyl transferase enzyme (HPRT) processes 6-MP to thio-IMP, which is then converted to thio-XMP and thio-GMP. Subsequent metabolism of thio-GMP by kinases and reductases yields thio-dGTP which is incorporated into replicating DNA strands and triggers the DNA mismatch-repair machinery, leading to cell cycle arrest and apoptosis. The anti-leukemic effects of 6-MP are in part also attributed to a second metabolic pathway whereby thiopurine S-methyl transferase (TPMT) methylates thio-IMP to form methylthio-IMP (MeTIMP), which is a potent inhibitor of amidophosphoribosyltransferase (ATase), an enzyme catalyzing the committed step of de novo purine biosynthesis.
Extended Data Figure 2
Extended Data Figure 2. Conditional knock-in targeting of Nt5c2, generation and analysis of a Nt5c2R367Q conditional inducible T-ALL model
a, Schematic representation of the targeting strategy for generation of Nt5c2+/co-R367Q conditional knock-in mice. b, Southern blot analysis of Nt5c2+/+ and targeted Nt5c2+/co-R367Q embryonic stem cells in DNA digestions with BamHI restriction enzyme hybridized with a DNA probe external to the long arm. c, Southern blot analysis of Nt5c2+/+ and targeted Nt5c2+/co-R367Q embryonic stem cells in DNA digestions with ApaI restriction enzyme hybridized with a DNA probe in the short arm. d, Schematic depiction of the strategy for developing conditional inducible Nt5c2+/co-R367Q primary murine T-ALL tumors and for assessing the role of Nt5c2+/R367Q on leukemia progression and response to chemotherapy. e, Representative FACS plot of a Rosa26+/CreERT2 Nt5c2+/co-R367Q ΔE-NOTCH1-induced primary T-ALL tumor with a CD4+, CD8+ immunophenotype. f, Representative genotyping PCR results from genomic DNA of a Rosa26+/CreERT2 Nt5c2+/co-R367Q ΔE-NOTCH1-induced primary T-ALL tumor treated with 4-hydroxytamoxifen (TMX) or vehicle only (ethanol, ETOH) in vitro showing Cre-mediated deletion of the exon 14–18 Nt5c2 wild type mini-gene. g, Tumor burden assessed in the spleen (% GFP+ cells) in mice allografted with NOTCH1-induced Nt5c2+/co-R367Q and isogenic Nt5c2+/R367Q primary leukemia cells treated with a range of 6-MP doses (n = 5 per group). h, Analysis of Nt5c2R367Q allele assessed by qPCR in mice allografted with Nt5c2+/co-R367Q and Nt5c2+/R367Q primary mouse T-ALL cells at a 1:10, 1:100 and 1:1000 Nt5c2+/R367Q:Nt5c2+/co-R367Q dilution treated with vehicle or 6-MP (n = 5 mice per group and n=3 technical replicates for the controls). The horizontal bar represents mean values. P values were calculated using two-tailed Student’s t-test in g and a one-tailed Student’s t-test in h. Data in e and f show representative results from >2 experiments.
Extended Data Figure 3
Extended Data Figure 3. Decreased expression of the Nt5c2R367Q allele upon leukemia progression in vivo
Sanger sequencing chromatograms of cDNA from tumors in Fig. 2c show decreased levels of Nt5c2R367Q expression over the Nt5c2+ wild type allele compared with freshly 4-hydroxytamoxifen treated deleted Rosa26+/CreERT2 Nt5c2+/co-R367Q cells (Fig. 1a). Mutant allele deoxynucleotides are indicated in red.
Extended Data Figure 4
Extended Data Figure 4. NT5C2 R367Q expression displays fitness loss in T-ALL and B-ALL cell lines
Diagram of the purine de novo biosynthesis and salvage pathways, showing GC/MS and LC/MS/MS metabolic profiles (mass spectrometry scaled intensity, arbitrary units) of CUTLL1 and REH cell lines expressing wild type (WT) NT5C2 or NT5C2 p.R367Q and their corresponding conditioned media (n=3 biological replicates per sample). Box plots represent the upper quartile to lower quartile distribution. + Sign indicates mean value and horizontal line the median value. Whiskers indicate the maximum and minimum values of the distribution.
Extended Data Figure 5
Extended Data Figure 5. NT5C2 mutations are late events ALL
Integrated Sequential Network (ISN) illustrating the sequential order of somatic mutations in relapsed ALL by pooling evolutionary paths across patients. Each node represents a gene, and each arrow points from a gene with an early event to a gene with a late event. To test whether a gene within the ISN was significantly early or late, we used a one-sided binomial test based on in-degree and out-degree of each node.
Extended Data Figure 6
Extended Data Figure 6. Guanosine rescue of mizoribine sensitivity in vitro and mizoribine activity against NT5C2 p.R367Q mutant cells in vivo
a, Cell viability assay showing drug responses of Nt5c2+/co-R367Q wild type primary mouse T-ALL cells to increasing doses of mizoribine in the presence of 20 μM guanosine (n=3 biological replicates). b, Cell viability assay results as in c documenting the effects of 20 μM guanosine in the response of isogenic Nt5c2+/R367Q mutant mouse T-ALL lymphoblasts to mizoribine (n=3 biological replicates). c, Analysis of tumor burden assessed by bioimaging in mice transplanted with Nt5c2+/co-R367Q wild type leukemia cells (left) or Nt5c2+/R367Q mutant leukemia cells (right) treated with a range of mizoribine doses (n = 8 mice for the vehicle group and n=4 mice per treated group). d, Quantification of data in c. e, Analysis of tumor burden assessed by spleen weight in mice allografted with NT5C2 wild type ALL-4 diagnosis or NT5C2 p. R367Q ALL-4 relapse patient derived leukemia cells treated with 100 mg kg−1 mizoribine b.i.d. (n=6 for diagnosis vehicle group, n=3 for relapse treated group and n=7 for diagnosis treated and relapse vehicle groups) f, Analysis of tumor burden assessed by % CD45+ cells in the bone marrow of mice allografted with NT5C2 wild type ALL-4 diagnosis or NT5C2 p.R367Q ALL-4 relapse patient derived leukemia cells treated with 100 mg kg−1 mizoribine b.i.d. (n=3–7 per group). Horizontal bar in a, b, d, e, and f indicates mean values. P values were calculated using two-tailed Student’s t-test.
Extended Data Figure 7
Extended Data Figure 7. 6-MP and IMPDH inhibition response in CUTLL1 cells
a, Cell viability assay showing drug responses of the CUTLL1 cell line infected with wild type or mutant NT5C2-expressing lentiviruses to increasing doses of 6-MP. b, Cell viability assays as in a documenting the response of CUTLL1 cells expressing NT5C2 mutations to mizoribine. c, Cell viability assay showing drug responses of CUTLL1 wild type T-ALL cells to increasing doses of mizoribine in the presence of 20 μM guanosine. d, Cell viability assay results as in c documenting the effects of 20 μM guanosine in the response of NT5C2 p.R367Q expressing CUTLL1 cells to mizoribine. e, Growth curve showing growth of CUTLL1 cells infected with a GFP shRNA control or IMPDH2 targeting shRNA. f, Growth curve showing growth of CUTLL1 cells expressing NT5C2 wild type (WT) or NT5C2 p.R367Q and infected with an IMPDH2 targeting shRNA. n=3 biological replicates for af. Horizontal bar in c, and d indicates mean values. P values were calculated using two-tailed Student’s t-test. * P ≤0.05.
Extended Data Figure 8
Extended Data Figure 8. 6-MP and IMPDH inhibition response in REH B-ALL cells
a, Cell viability assay showing drug responses of the REH cell line infected with wild type or mutant NT5C2-expressing lentiviruses to increasing doses of 6-MP. b, Cell viability assays as in a documenting the response of REH cells expressing NT5C2 mutations to mizoribine. c, Cell viability assay showing drug responses of REH wild type T-ALL cells to increasing doses of mizoribine in the presence of 20 μM guanosine. d, Cell viability assay results as in c documenting the effects of 20 μM guanosine in the response of NT5C2 p.R367Q expressing REH cells to mizoribine. e, Growth curve showing growth of REH cells infected with a GFP shRNA control or IMPDH2 targeting shRNA. f, Growth curve showing growth of REH cells expressing NT5C2 wild type (WT) or NT5C2 p.R367Q and infected with an IMPDH2 targeting shRNA. n=3 biological replicates for af. Horizontal bar in c, and d indicates mean values. P values were calculated using two-tailed Student’s t-test. * P ≤0.05.
Figure 1
Figure 1. Expression of Nt5c2R367Q in NOTCH1-induced mouse ALL induces resistance to 6-MP
a, cDNA sequencing chromatograms of Nt5c2+/co-R367Q wild type and Nt5c2+/R367Q R367Q-expressing isogenic T-ALL cells. b, Cell viability of isogenic Nt5c2+/co-R367Q and Nt5c2+/R367Q T-ALLs treated with 6-MP (n=3 biological replicates). c, Percentage of Nt5c2+/R367Q T-ALL cells in a mixed culture with isogenic Nt5c2+/co-R367Q cells treated with 6-MP (n=3 biological replicates). d, Tumor burden in mice allografted with Nt5c2+/co-R367Q leukemia cells treated with 6-MP (n = 6 mice in the vehicle group and 5 per treatment group). e, Analysis of mice allografted with isogenic Nt5c2+/R367Q tumor cells treated as in d (n=5 mice per group). P values were calculated using two-tailed Student’s t-test. ** P ≤0.01, *** P ≤0.001. Data in a, b show representative results from >2 experiments.
Figure 2
Figure 2. Nt5c2R367Q expression impairs proliferation and leukemia initiating cell activity in ALL
a, In vitro cell growth of isogenic Nt5c2+/co-R367Q wild type and Nt5c2+/R367Q mutant mouse T-ALLs (n=3 biological replicates). b, Cell cycle progression of Nt5c2+/co-R367Q and Nt5c2+/R367Q mouse T-ALLs (n=3 biological replicates). c, Kaplan-Meier survival curve of mice harboring Nt5c2+/co-R367Q and Nt5c2+/R367Q isogenic leukemias (n=6 per group). d, Leukemia initiating cell analysis in mice bearing Nt5c2+/co-R367Q or isogenic Nt5c2+/R367Q leukemia cells (n=6 mice per group). e, Confidence intervals showing 1/(stem cell frequency) (n=6 mice per group) based on d. P values in a and b were calculated using two-tailed Student’s t-test. * P ≤0.05, ** P ≤0.005, *** P ≤0.001. P value in c was calculated with a two-sided Log-rank test. Data in a, b show representative results from >2 experiments.
Figure 3
Figure 3. Nt5c2R367Q decreases the intracellular purine nucleoside pool and increases secretion of purines in ALL cells
Diagram of the purine de novo biosynthesis and salvage pathways, showing GC/MS and LC/MS/MS metabolic profiles (mass spectrometry scaled intensity, arbitrary units) of Nt5c2+/co-R367Q wild type and Nt5c2+/R367Q mutant isogenic primary murine T-ALL cells and their corresponding conditioned media (n=3 biological replicates). Box plots represent the upper quartile to lower quartile distribution. + Sign indicates mean value and horizontal line the median value. Whiskers indicate the maximum and minimum values.
Figure 4
Figure 4. Collateral sensitivity to IMPDH inhibition in NT5C2 R367Q mutant tumor cells
a, Cell viability of isogenic Nt5c2+/co-R367Q wild type and Nt5c2+/R367Q mutant T-ALLs treated with mizoribine (n=3 biological replicates). b, Kaplan-Meier survival curve of mice harboring Nt5c2+/co-R367Q and Nt5c2+/R367Q isogenic leukemias (n=10 mice per group) treated with mizoribine or vehicle (green bar). c,f, DNA sequencing chromatograms corresponding to matched primary human diagnosis (NT5C2 wild type) and relapsed (NT5C2 p.R367Q) T-ALL xenografts. d,g, Cell viability in samples evaluated in c,f showing resistance to 6-MP in relapsed (NT5C2 p.R367Q) T-ALL xenograft cells (n=3 biological replicates). e,g, Cell viability in samples analyzed in c,f and d,g showing collateral sensitivity to mizoribine in relapsed (NT5C2 p.R367Q) T-ALL xenograft cells (n=3 biological replicates). P values in a, d, e, g and h were calculated using two-tailed Student’s t-test. P value in b was calculated with a two-sided Log-rank test. Data in a, d, e, g, and h show representative results from >2 experiments.

References

    1. Hunger SP, Mullighan CG. Acute Lymphoblastic Leukemia in Children. The New England journal of medicine. 2015;373:1541–1552. doi: 10.1056/NEJMra1400972. - DOI - PubMed
    1. Tzoneva G, et al. Activating mutations in the NT5C2 nucleotidase gene drive chemotherapy resistance in relapsed ALL. Nature medicine. 2013;19:368–371. doi: 10.1038/nm.3078. - DOI - PMC - PubMed
    1. Meyer JA, et al. Relapse-specific mutations in NT5C2 in childhood acute lymphoblastic leukemia. Nature genetics. 2013;45:290–294. doi: 10.1038/ng.2558. - DOI - PMC - PubMed
    1. Gerby B, et al. Expression of CD34 and CD7 on human T-cell acute lymphoblastic leukemia discriminates functionally heterogeneous cell populations. Leukemia. 2011;25:1249–1258. doi: 10.1038/leu.2011.93. - DOI - PubMed
    1. Cox CV, Diamanti P, Evely RS, Kearns PR, Blair A. Expression of CD133 on leukemia-initiating cells in childhood ALL. Blood. 2009;113:3287–3296. doi: 10.1182/blood-2008-04-154187. - DOI - PubMed

Publication types

MeSH terms