

doi: 10.1371/journal.pone.0189426.
eCollection 2018.
Expression of the lux genes in Streptococcus pneumoniae modulates pilus expression and virulence
Affiliations
- PMID: 29342160
- PMCID: PMC5771582
- DOI: 10.1371/journal.pone.0189426
Item in Clipboard
Expression of the lux genes in Streptococcus pneumoniae modulates pilus expression and virulence
PLoS One.
.
Abstract
Bioluminescence has been harnessed for use in bacterial reporter systems and for in vivo imaging of infection in animal models. Strain Xen35, a bioluminescent derivative of Streptococcus pneumoniae serotype 4 strain TIGR4 was previously constructed for use for in vivo imaging of infections in animal models. We have shown that strain Xen35 is less virulent than its parent TIGR4 and that this is associated with the expression of the genes for bioluminescence. The expression of the luxA-E genes in the pneumococcus reduces virulence and down regulates the expression of the pneumococcal pilus.
Conflict of interest statement
Figures

(A) Percentage survival of mice intra-nasally inoculated with TIGR4 or Xen35 over time, statistical analysis was performed using a logrank Test, * P<0.01. * above the strain indicated a statistical difference compared to Xen35. Only the survival group was used for analysis (n = 5 per bacterial strain) (B) Percentage weight loss of mice infected with either Xen35 or TIGR4. All groups were used for analysis, later groups have smaller numbers due to some mice being sacrificed. Statistical analysis was performed using a non-parametric Mann-Whitney two sample rank test, *P<0.001.

Bacterial counts were enumerated from 5 mice at 24 hours post infection from mice infected via the IP route with a 1:1 mix of Xen35 and TIGR4. Bacterial counts were enumerated from brain, lungs, nasal wash, liver, spleen and blood for each strain by differential plating onto kanamycin. Statistical analysis was performed comparing TIGR4 and Xen35 raw counts using a non-parametric Mann-Whitney two sample rank test, *P< 0.05, ** P<0.01. Above is the competitive index calculated from the raw counts. */ ** above the organ/ body fluid shows a statistically lower bacterial count of Xen35 compared to TIGR4.
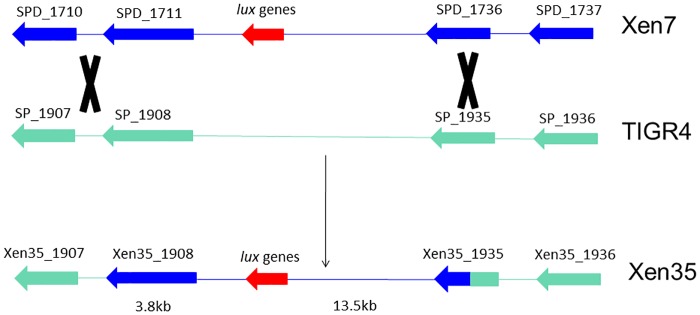
Diagram shows region recombined into TIGR4 during transformation with Xen7 DNA. Dark blue indicates Xen7 DNA and green TIGR4 DNA. Along with the lux genes a large region spanning 17.3Kb was also recombined into TIGR4 creating Xen35.

(A) Graph shows RT-PCR of the whole pilus islet (rlrA, rrgA, rrgB, rrgC, srtB, srtC, srtD), psrP, SP_1914 and SP_1915 in Xen35. Fold change represents that of Xen35 compared to TIGR4. Each bar represents the average of at least two replicas and errors bars the standard deviation. (B) Western blotting analysis was performed on TIGR4, Xen35 and T4ΔrrgB looking at RrgB protein expression in all strains (α-RrgB antibody). Equal protein loading was confirmed by equal expression of GroEL (α-GroEL antibody).

Diagram shows lux gene insertion site in Xen7 and recombination into TIGR4 creating Xen35. Dark blue indicates Xen7 DNA and green TIGR4 DNA. Red genes represent the 5 lux genes, yellow the kanamycin resistant cassette. In Xen7 these genes inserted in SPD_1717 making the gene non-functional. SDP-1717 homologue in TIGR4 is SP_1914 in which the lux genes are inserted in Xen35 making it non-functional. In light blue is the predicted promoter site located downstream of SPD_1717 and SP_1914 in Xen7 and Xen35 respectively. Thought to be pushing expression of the lux genes in both strains.

(A) Graph of bioluminescence of Xen35, TIGR4 and the T4P strains over time. Each point on the graph represents the average of a triplicate reading, Readings were taken every 20 minutes. (B) Western blotting analysis was performed on TIGR4, T4P1, P2, P3, P4 and T4ΔrrgB looking at RrgB protein expression in all strains (α-RrgB antibody). Equal protein loading was confirmed by equal expression of GroEL (α-GroEL antibody).

Graph shows expression of luxA-E and the pilus islet genes (rlrA, rrgA, rrgB, rrgC, srtB, srtC, srtD) in T4P2. Fold change represents that of T4P2 compared to Xen35. Each bar represents the average of at least two replicas and error bars the standard deviation.

(A) Shows percentage survival of mice infected with TIGR4, Xen35 or T4P2 over time, statistical analysis was performed comparing T4P2 to TIGR4 or T4P2 to Xen35 using a logrank Test, * P<0.01. * above the strain indicated a statistical difference compared to T4P2. Only the survival group was used for analysis (n = 5 per bacterial strain) (B) Shows percentage weight loss of mice infected with Xen35, TIGR4 or T4P2. All groups were used for analysis; later groups have smaller numbers due to some mice being sacrificed. Statistical analysis was performed using a non-parametric Mann-Whitney two sample rank test, *P< 0.01 and **P<0.001.

(A) Reaction catalysed by luciferase enzyme (Flavin reductase) leading to light emission (bioluminescence). Reaction requires reduced riboflavin (FMNH2), long chain aldehyde (RCHO) and oxygen (O2) resulting in flavin mononucleotide (FMN), Water (H2O), fatty acids (RCOOH) and light [3] (B) Diagram showing adenosine triphosphate (ATP), reduced nicotinamide adenine dinucleotide (NADH), adenosine diphosphate (ADP) and oxidised nicotinamide adenine dinucleotide (NAD+) production and utilisation during glycolysis and pyruvate metabolism in S. pneumoniae [46]. (C) Reaction catalysed by the fatty acid reductase complex required to produce the long chain aldehyde substrate for the luciferase enzyme. Reaction requires RCOOH, ATP, reduced nicotinamide adenine dinucleotide phosphate (NADPH) resulting in nicotinamide adenine dinucleotide phosphate (NADP), adenosine monophosphate (AMP), pyrophosphate (PPi) and RCHO [3].
References
-
- van der Linden M, Al-Lahham A, Nicklas W, Reinert RR. Molecular characterization of pneumococcal isolates from pets and laboratory animals. PLoS One. 2009;4(12):e8286 doi: 10.1371/journal.pone.0008286 - DOI - PMC - PubMed
-
- Chi F, Leider M, Leendertz F, Bergmann C, Boesch C, Schenk S, et al. New Streptococcus pneumoniae clones in deceased wild chimpanzees. J Bacteriol. 2007;189(16):6085–8. doi: 10.1128/JB.00468-07 - DOI - PMC - PubMed
-
- Havarstein LS, Gaustad P, Nes IF, Morrison DA. Identification of the streptococcal competence- pheromone receptor. Molecular Microbiology. 1996;21(4):863–9. - PubMed
Publication types
MeSH terms
LinkOut - more resources
Full Text Sources
Other Literature Sources
Molecular Biology Databases
