. 2018 Jan 17;13(1):e0191341.
doi: 10.1371/journal.pone.0191341. eCollection 2018.

Differentiation of glioblastoma multiforme, metastases and primary central nervous system lymphomas using multiparametric perfusion and diffusion MR imaging of a tumor core and a peritumoral zone-Searching for a practical approach

Affiliations

Differentiation of glioblastoma multiforme, metastases and primary central nervous system lymphomas using multiparametric perfusion and diffusion MR imaging of a tumor core and a peritumoral zone-Searching for a practical approach

Małgorzata Neska-Matuszewska et al. PLoS One. .

Abstract

Introduction: In conventional MR examinations glioblastomas multiforme (GBMs), metastases and primary CNS lymphomas (PCNSLs) may show very similar appearance. The aim of the study was to evaluate usefulness of multiparametric T2*DSC perfusion and diffusion MR imaging in the preoperative differentiation of these tumors.

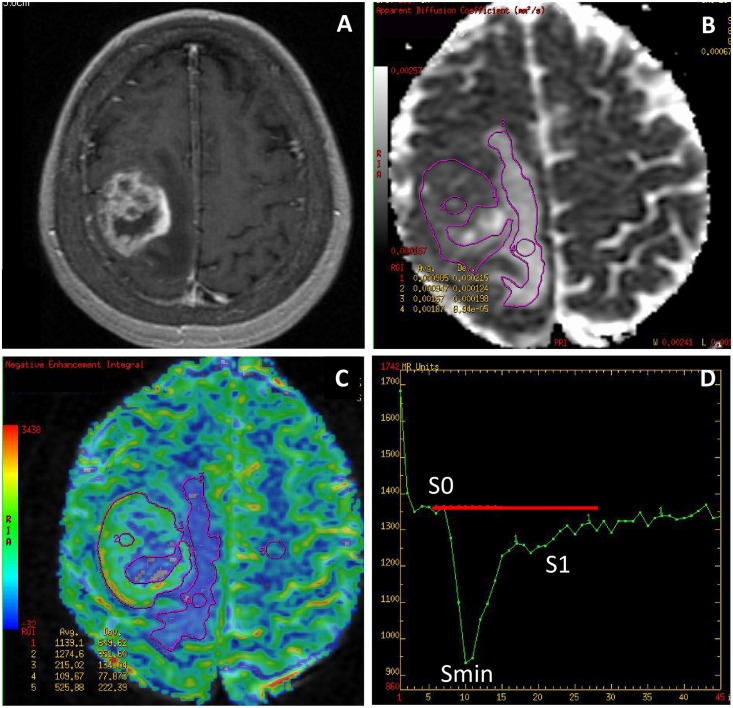
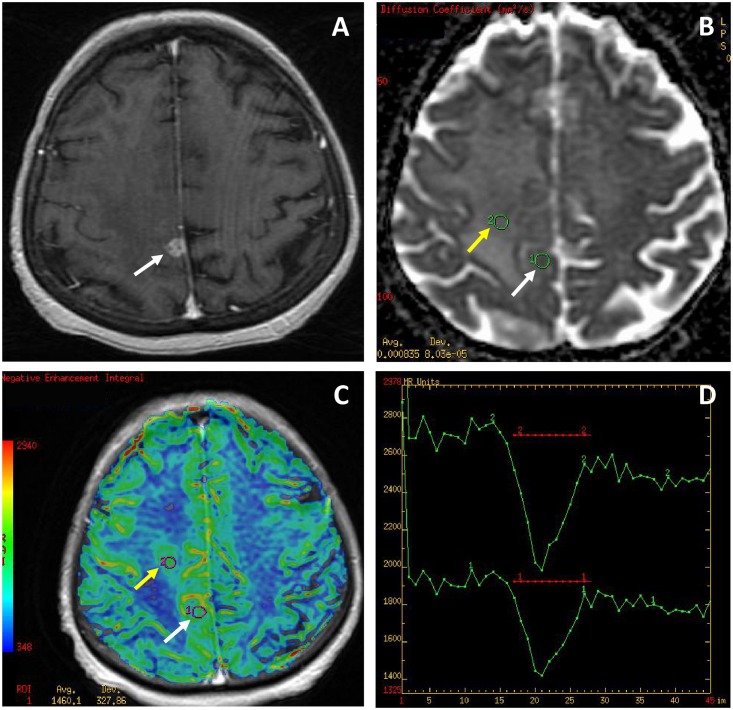
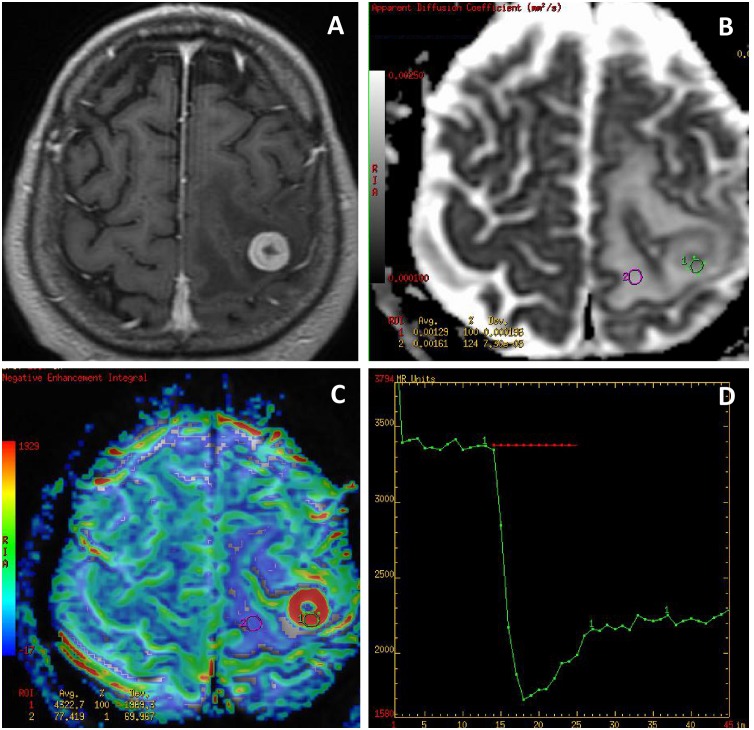
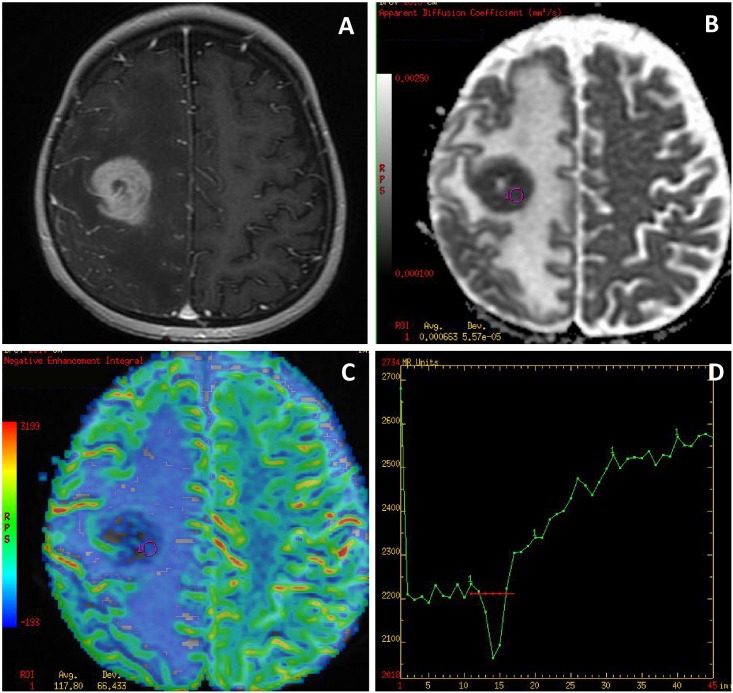
Material and methods: Seventy four solitary enhancing tumors (27 GBMs, 30 metastases, 17 PCNSLs) were enrolled in the study. Parameters of cerebral blood volume (rCBV), peak height (rPH), percentage of signal recovery (rPSR) and apparent diffusion coefficient (ADC) were assessed from the tumor core and the peritumoral non-enhancing T2-hyperintense zone.

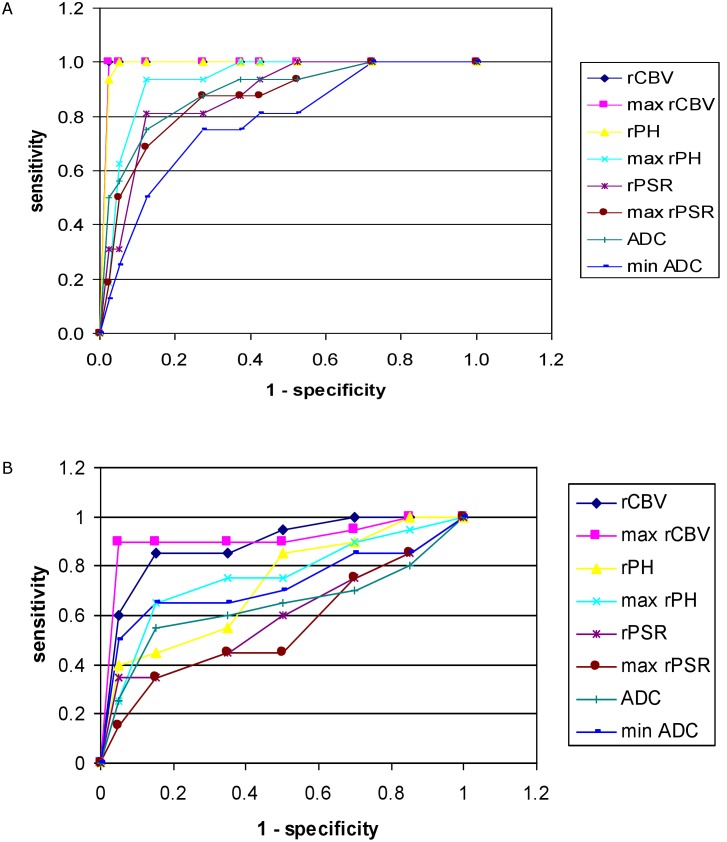
Results: Within the tumor core there were no differences in perfusion and diffusion parameters between GBMs and metastases. Compared to GBMs and metastases, PCNSLs showed significantly lower rCBV and rPH, ADC as well as higher rPSR values. Max rCBV with a cut-off value of 2.18 demonstrated the highest accuracy of 0.98 in differentiating PCNSLs from other tumors. To distinguish GBMs from metastases analysis of the peritumoral zone was performed showing significantly higher rCBV, rPH and lower ADC values in GBMs with the highest accuracy of 0.94 found for max rCBV at a cut-off value of 0.98.

Conclusions: Max rCBV seems to be the most important parameter to differentiate GBMs, metastases and PCNSLs. Analysis of max rCBV within the tumor core enables to distinguish hypoperfused PCNSLs from hyperperfused GBMs and metastases while evaluation of max rCBV within the peritumoral zone is helpful to distinguish GBMs showing peritumoral infiltration from metastases surrounded by pure edema.


Conflict of interest statement

Competing Interests: The authors have declared that no competing interests exist.

Figures

Fig 1
Fig 1. Glioblastoma multiforme (GBM).
(A) a post-contrast T1-weighted image, (B) an ADC map, (C) a CBV map, (D) a perfusion signal intensity time curve. The ADC (B) and CBV (C) maps show placement of large irregular freehand ROIs within the tumor core and the peritumoral edema as well as small circular ROIs within the big ROIs and in the contralateral normal white matter used as a reference ROI. The perfusion curve (D) shows hemodynamics of contrast agent during the first pass of a bolus through the brain vasculature with an x-axis reflecting time in seconds and y-axis indicating signal intensity. Red transverse line is a baseline.
Fig 2
Fig 2. Glioblastoma multiforme (GBM).
(A) a post-contrast T1-weighted image, (B) an ADC map, (C) a CBV map, (D) perfusion signal intensity time curves. The tumor appears as a small enhancing lesion (white arrows) with a large non-enhancing peritumoral zone mimicking a metastasis. The ADC map (B) shows minimal ADC values similar to normal white matter (0.83 x 10⁻³ mm2/s within the tumor core and 0.78 x 10⁻³ mm2/s within the peritumoral region of infiltration). The CBV map (C) shows the hyperperfused tumor core (white arrow, max rCBV = 2.9) and a large area of increased perfusion (yellow arrow, max rCBV = 2.25) within the peritumoral zone indicating neoplastic infiltration which is a feature differentiating GBM from a metastasis surrounded exclusively by a pure vasogenic edema. The perfusion curves (D) present only partial return to the baseline (red transverse line) in both the tumor core (lower curve) and the area of neoplastic infiltration (upper curve).
Fig 3
Fig 3. A solitary metastasis.
(A) a post-contrast T1-weighted image, (B) an ADC map, (C) a CBV map, (D) a perfusion signal intensity time curve. The ADC map (B) shows facilitated diffusion in both the tumor core (min ADC = 1.0 x 10⁻³ mm2/s) and in the peritumoral zone (min ADC = 1.32 x 10⁻³ mm2/s). The CBV map (C) shows a highly perfused tumor (max rCBV = 17.9) and no hyperperfusion within the peritumoral zone (max rCBV = 0.78) typical for pure vasogenic edema. The perfusion curve (D) presents partial return to the baseline (red transverse line).
Fig 4
Fig 4. Primary central nervous system lymphoma (PCNSL).
(A) a post-contrast T1-weighted image, (B) an ADC map, (C) a CBV map, (D) a perfusion signal intensity time curve. The tumor appears as an enhancing solitary lesion with a large peritumoral edema mimicking a metastasis. The ADC map (B) shows restricted diffusion within the tumor core (min ADC = 0.51 x 10⁻³ mm2/s). The CBV map (C) shows the hypoperfused tumor core (max rCBV = 0.79) with the perfusion curve (D) returning above the baseline (red transverse line) which are typical perfusion characteristics of PCNSL.
Fig 5
Fig 5. Receiver operating characteristic (ROC) curve.
ROC analysis for comparisons of perfusion and diffusion parameters from the tumor core (A) which are used for differentiation of PCNSLs from GBMs and metastases as well as from the peritumoral zone (B) used for differentiation of GBMs from metastases. Both graphs A and B show the highest accuracy (the largest area under the curve) for the values of max rCBV.

References

    1. Omuro A, DeAngelis LM. Glioblastoma and other malignant gliomas: a clinical review. JAMA. 2013;310:1842–1850. doi: 10.1001/jama.2013.280319 - DOI - PubMed
    1. Sperduto PW, Chao ST, Sneed PK, Luo X, Suh J, Roberge D, et al. Diagnosis-specific prognostic factors, indexes, and treatment outcomes for patients with newly diagnosed brain metastases: a multi-institutional analysis of 4,259 patients. Int J Radiat Oncol Biol Phys. 2010;77:655–661. doi: 10.1016/j.ijrobp.2009.08.025 - DOI - PubMed
    1. Pasricha S, Gupta A, Gawande J, Trivedi P, Patel D. Primary central nervous system lymphoma: a study of clinicopathological features and trend in western India. Indian J Cancer. 2011;48:199–203. doi: 10.4103/0019-509X.82890 - DOI - PubMed
    1. Cha S. Update on brain tumor imaging: from anatomy to physiology. Am J Neuroradiol. 2006;27:475–487. - PMC - PubMed
    1. Sugahara T, Korogi Y, Kochi M, Ikushima I, Shigematu Y, Hirai T, et al. Usefulness of diffusion-weighted MRI with echo-planar technique in the evaluation of cellularity in gliomas. J Magn Reson Imaging. 1999;9:53–60. - PubMed

Publication types

MeSH terms