Genotype-by-environment interactions affecting heterosis in maize
- PMID: 29342221
- PMCID: PMC5771596
- DOI: 10.1371/journal.pone.0191321
Genotype-by-environment interactions affecting heterosis in maize
Erratum in
-
Correction: Genotype-by-environment interactions affecting heterosis in maize.PLoS One. 2019 Aug 5;14(8):e0219528. doi: 10.1371/journal.pone.0219528. eCollection 2019. PLoS One. 2019. PMID: 31381609 Free PMC article.
Abstract
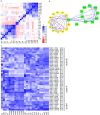
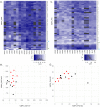
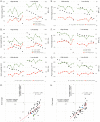
The environment can influence heterosis, the phenomena in which the offspring of two inbred parents exhibits phenotypic performance beyond the inbred parents for specific traits. In this study we measured 25 traits in a set of 47 maize hybrids and their inbred parents grown in 16 different environments with varying levels of average productivity. By quantifying 25 vegetative and reproductive traits across the life cycle we were able to analyze interactions between the environment and multiple distinct instances of heterosis. The magnitude and rank among hybrids for better-parent heterosis (BPH) varied for the different traits and environments. Across the traits, a higher within plot variance was observed for inbred lines compared to hybrids. However, for most traits, variance across environments was not significantly different for inbred lines compared to hybrids. Further, for many traits the correlations of BPH to hybrid performance and BPH to better parent performance were of comparable magnitude. These results indicate that inbred lines and hybrids show similar trends in environmental response and both are contributing to observed genotype-by-environment interactions for heterosis. This study highlights the degree of heterosis is not an inherent trait of a specific hybrid, but varies depending on the trait measured and the environment where that trait is measured. Studies that attempt to correlate molecular processes with heterosis are hindered by the fact that heterosis is not a consistent attribute of a specific hybrid.
Conflict of interest statement
Figures


Similar articles
-
Heterosis is prevalent for multiple traits in diverse maize germplasm.PLoS One. 2009 Oct 13;4(10):e7433. doi: 10.1371/journal.pone.0007433. PLoS One. 2009. PMID: 19823591 Free PMC article.
-
Gene expression analyses in maize inbreds and hybrids with varying levels of heterosis.BMC Plant Biol. 2008 Apr 10;8:33. doi: 10.1186/1471-2229-8-33. BMC Plant Biol. 2008. PMID: 18402703 Free PMC article.
-
Genetic dissection of yield-related traits and mid-parent heterosis for those traits in maize (Zea mays L.).BMC Plant Biol. 2019 Sep 9;19(1):392. doi: 10.1186/s12870-019-2009-2. BMC Plant Biol. 2019. PMID: 31500559 Free PMC article.
-
Molecular dissection of heterosis in cereal roots and their rhizosphere.Theor Appl Genet. 2023 Jul 20;136(8):173. doi: 10.1007/s00122-023-04419-6. Theor Appl Genet. 2023. PMID: 37474870 Free PMC article. Review.
-
Allelic variation and heterosis in maize: how do two halves make more than a whole?Genome Res. 2007 Mar;17(3):264-75. doi: 10.1101/gr.5347007. Epub 2007 Jan 25. Genome Res. 2007. PMID: 17255553 Review.
Cited by
-
Additive and heterozygous (dis)advantage GWAS models reveal candidate genes involved in the genotypic variation of maize hybrids to Azospirillum brasilense.PLoS One. 2019 Sep 19;14(9):e0222788. doi: 10.1371/journal.pone.0222788. eCollection 2019. PLoS One. 2019. PMID: 31536609 Free PMC article.
-
LightGBM: accelerated genomically designed crop breeding through ensemble learning.Genome Biol. 2021 Sep 20;22(1):271. doi: 10.1186/s13059-021-02492-y. Genome Biol. 2021. PMID: 34544450 Free PMC article.
-
An Evaluation of Morphometric Characteristics of Honey Bee (Apis cerana) Populations in the Qinghai-Tibet Plateau in China.Life (Basel). 2025 Feb 7;15(2):255. doi: 10.3390/life15020255. Life (Basel). 2025. PMID: 40003664 Free PMC article.
-
Combined transcriptome and metabolome analysis reveals the effects of light quality on maize hybrids.BMC Plant Biol. 2023 Jan 18;23(1):41. doi: 10.1186/s12870-023-04059-4. BMC Plant Biol. 2023. PMID: 36653749 Free PMC article.
-
Performances of three-way cross hybrids over their respective single crosses and related heterosis of maize (Zea mays L.) hybrids evaluated in Ethiopia.Heliyon. 2023 Apr 21;9(5):e15513. doi: 10.1016/j.heliyon.2023.e15513. eCollection 2023 May. Heliyon. 2023. PMID: 37144203 Free PMC article.
References
-
- Janick J. Hybrids in horticultural crops Concepts and breeding of heterosis in crop plants. 1998;(conceptsandbree):45–56.
-
- Melchinger AE, Gumber RK. Overview of heterosis and heterotic groups in agronomic crops Concepts and breeding of heterosis in crop plants. 1998;(conceptsandbree):29–44.
-
- Troyer AF. Adaptedness and Heterosis in Corn and Mule Hybrids. Crop Science. 2006;46(2):528–43. doi: 10.2135/cropsci2005.0065 - DOI
-
- East EM. Inbreeding in corn. Conn Agric Exp Stn Rep. 1908;(419–428).
-
- Shull GH. The composition of a field of maize. Journal of Heredity. 1908;os-4(1):296–301. doi: 10.1093/jhered/os-4.1.296 - DOI
Publication types
MeSH terms
LinkOut - more resources
Full Text Sources
Other Literature Sources

