

Empagliflozin Treatment Is Associated With Improved β-Cell Function in Type 2 Diabetes Mellitus
- PMID: 29342295
- PMCID: PMC7328850
- DOI: 10.1210/jc.2017-01838
Empagliflozin Treatment Is Associated With Improved β-Cell Function in Type 2 Diabetes Mellitus
Abstract
Objective: To examine whether lowering plasma glucose concentration with the sodium-glucose transporter-2 inhibitor empagliflozin improves β-cell function in patients with type 2 diabetes mellitus (T2DM).
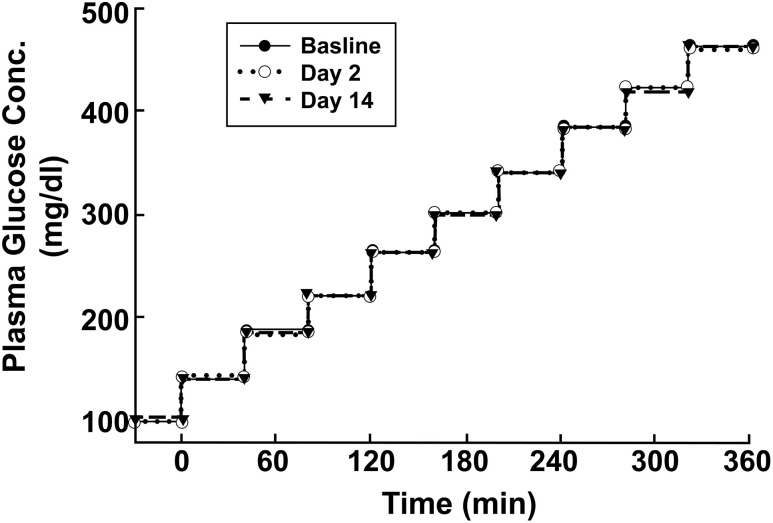
Methods: Patients with T2DM (N = 15) received empagliflozin (25 mg/d) for 2 weeks. β-Cell function was measured with a nine-step hyperglycemic clamp (each step, 40 mg/dL) before and at 48 hours and at 14 days after initiating empagliflozin.
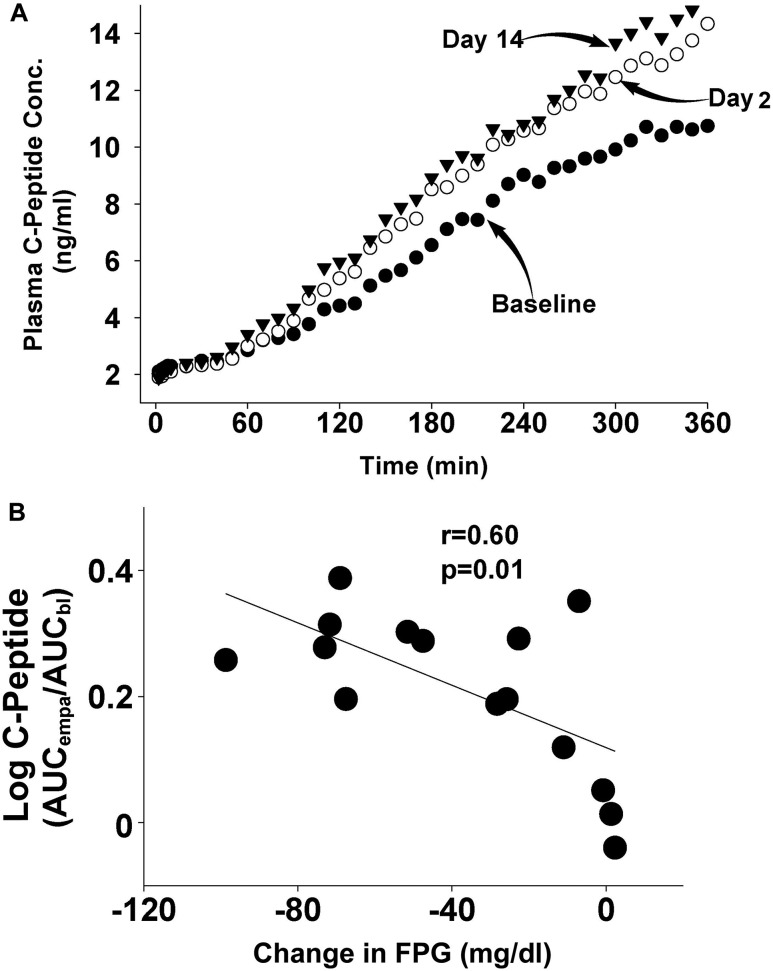
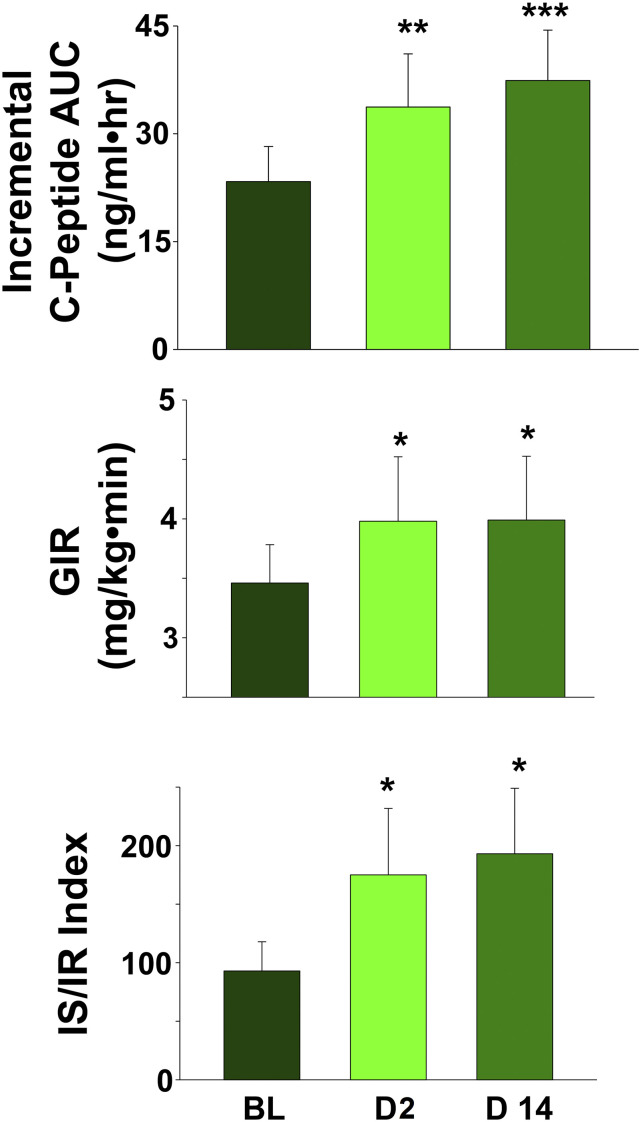
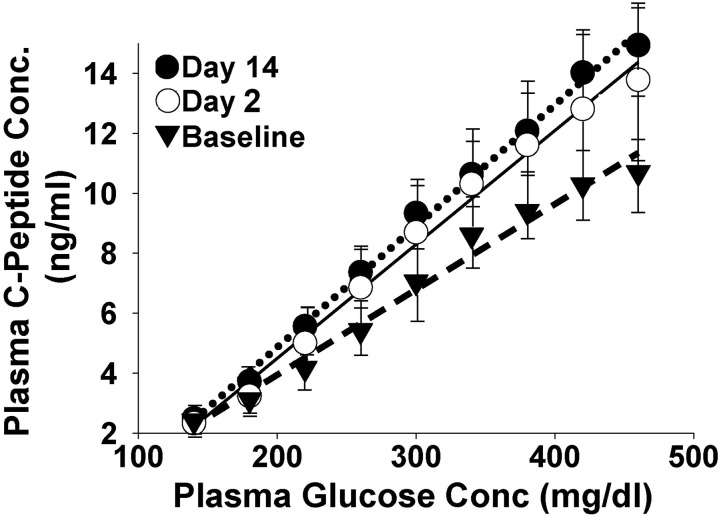
Results: Glucosuria was recorded on days 1 and 14 [mean ± standard error of the mean (SEM), 101 ± 10 g and 117 ± 11 g, respectively] after initiating empagliflozin, as were reductions in fasting plasma glucose levels (25 ± 6 mg/dL and 38 ± 8 mg/dL, respectively; both P < 0.05). After initiating empagliflozin and during the stepped hyperglycemic clamp, the incremental area under the plasma C-peptide concentration curve increased by 48% ± 12% at 48 hours and 61% ± 10% at 14 days (both P < 0.01); glucose infusion rate increased by 15% on day 3 and 16% on day 14, compared with baseline (both P < 0.05); and β-cell function, measured with the insulin secretion/insulin resistance index, increased by 73% ± 21% at 48 hours and 112% ± 20% at 14 days (both P < 0.01). β-cell glucose sensitivity during the hyperglycemic clamp was enhanced by 42% at 14 hours and 54% at 14 days after initiating empagliflozin (both P < 0.01).
Conclusion: Lowering the plasma glucose concentration with empagliflozin in patients with T2DM augmented β-cell glucose sensitivity and improved β-cell function.
Figures
References
-
- Talchai C, Lin HV, Kitamura T, Accili D. Genetic and biochemical pathways of beta-cell failure in type 2 diabetes. Diabetes Obes Metab. 2009;11(Suppl 4):38–45. - PubMed
-
- Kashyap S, Belfort R, Gastaldelli A, Pratipanawatr T, Berria R, Pratipanawatr W, Bajaj M, Mandarino L, DeFronzo R, Cusi K. A sustained increase in plasma free fatty acids impairs insulin secretion in nondiabetic subjects genetically predisposed to develop type 2 diabetes. Diabetes. 2003;52(10):2461–2474. - PubMed
-
- Giaccari A, Sorice G, Muscogiuri G. Glucose toxicity: the leading actor in the pathogenesis and clinical history of type 2 diabetes - mechanisms and potentials for treatment. Nutr Metab Cardiovasc Dis. 2009;19(5):365–377. - PubMed
Publication types
MeSH terms
Substances
Grants and funding
LinkOut - more resources
Full Text Sources
Other Literature Sources
Medical
