

Using Phylogenomic Data to Explore the Effects of Relaxed Clocks and Calibration Strategies on Divergence Time Estimation: Primates as a Test Case
- PMID: 29342307
- PMCID: PMC6005039
- DOI: 10.1093/sysbio/syy001
Using Phylogenomic Data to Explore the Effects of Relaxed Clocks and Calibration Strategies on Divergence Time Estimation: Primates as a Test Case
Abstract
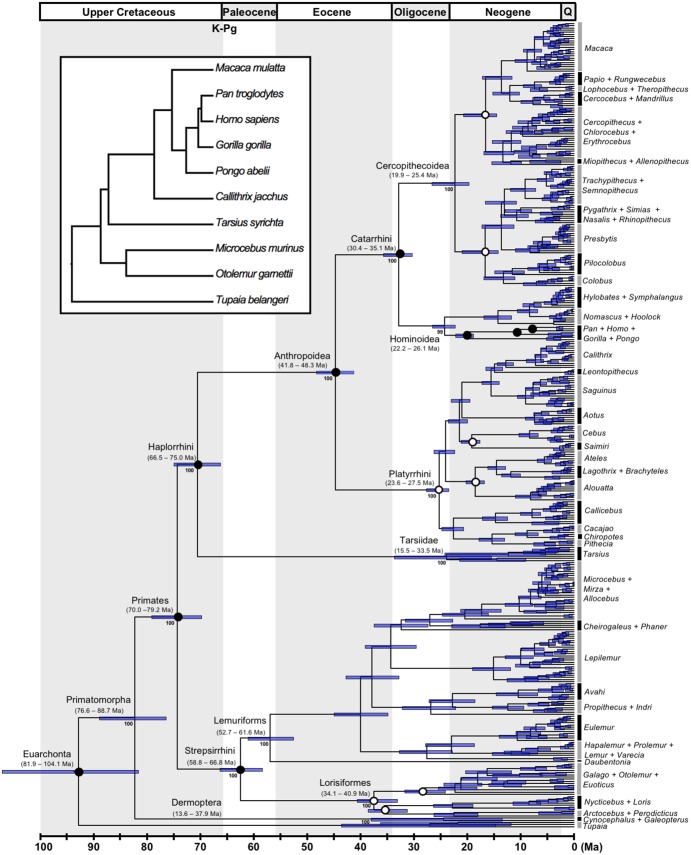
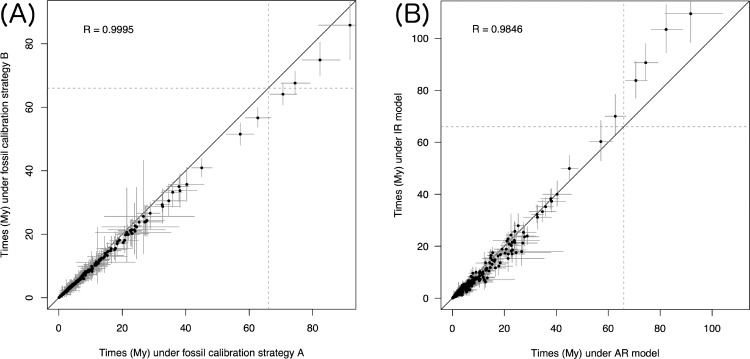
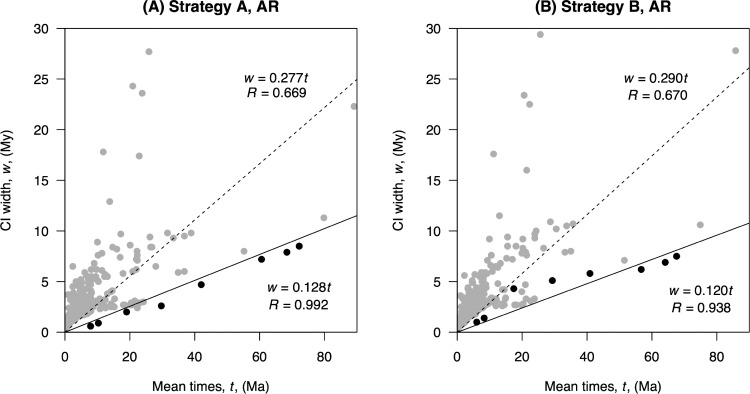
Primates have long been a test case for the development of phylogenetic methods for divergence time estimation. Despite a large number of studies, however, the timing of origination of crown Primates relative to the Cretaceous-Paleogene (K-Pg) boundary and the timing of diversification of the main crown groups remain controversial. Here, we analysed a data set of 372 taxa (367 Primates and 5 outgroups, 3.4 million aligned base pairs) that includes nine primate genomes. We systematically explore the effect of different interpretations of fossil calibrations and molecular clock models on primate divergence time estimates. We find that even small differences in the construction of fossil calibrations can have a noticeable impact on estimated divergence times, especially for the oldest nodes in the tree. Notably, choice of molecular rate model (autocorrelated or independently distributed rates) has an especially strong effect on estimated times, with the independent rates model producing considerably more ancient age estimates for the deeper nodes in the phylogeny. We implement thermodynamic integration, combined with Gaussian quadrature, in the program MCMCTree, and use it to calculate Bayes factors for clock models. Bayesian model selection indicates that the autocorrelated rates model fits the primate data substantially better, and we conclude that time estimates under this model should be preferred. We show that for eight core nodes in the phylogeny, uncertainty in time estimates is close to the theoretical limit imposed by fossil uncertainties. Thus, these estimates are unlikely to be improved by collecting additional molecular sequence data. All analyses place the origin of Primates close to the K-Pg boundary, either in the Cretaceous or straddling the boundary into the Palaeogene.
Figures
References
-
- Aris-Brosou S.,, Yang Z. 2002. Effects of models of rate evolution on estimation of divergence dates with special reference to the metazoan 18S ribosomal RNA phylogeny. Syst. Biol. 51:703–714. - PubMed
-
- Badgley C.,, Behrensmeyer A.K. 1995. Two long geological records of continental ecosystems. Palaeogeogr. Palaeoclimatol. Palaeoecol. 115:1–11.
Publication types
MeSH terms
Associated data
Grants and funding
LinkOut - more resources
Full Text Sources
Other Literature Sources
