. 2018 Jan 16;48(1):120-132.e8.
doi: 10.1016/j.immuni.2017.11.020.

Oxysterol Sensing through the Receptor GPR183 Promotes the Lymphoid-Tissue-Inducing Function of Innate Lymphoid Cells and Colonic Inflammation

Affiliations

Oxysterol Sensing through the Receptor GPR183 Promotes the Lymphoid-Tissue-Inducing Function of Innate Lymphoid Cells and Colonic Inflammation

Johanna Emgård et al. Immunity. .

Abstract

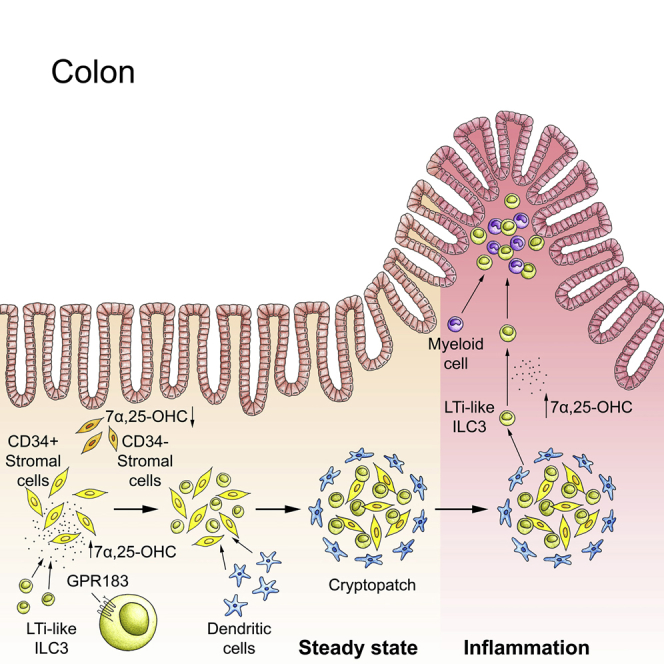
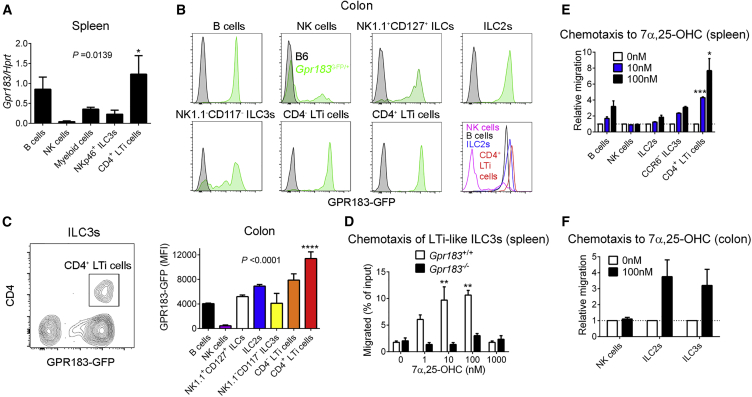
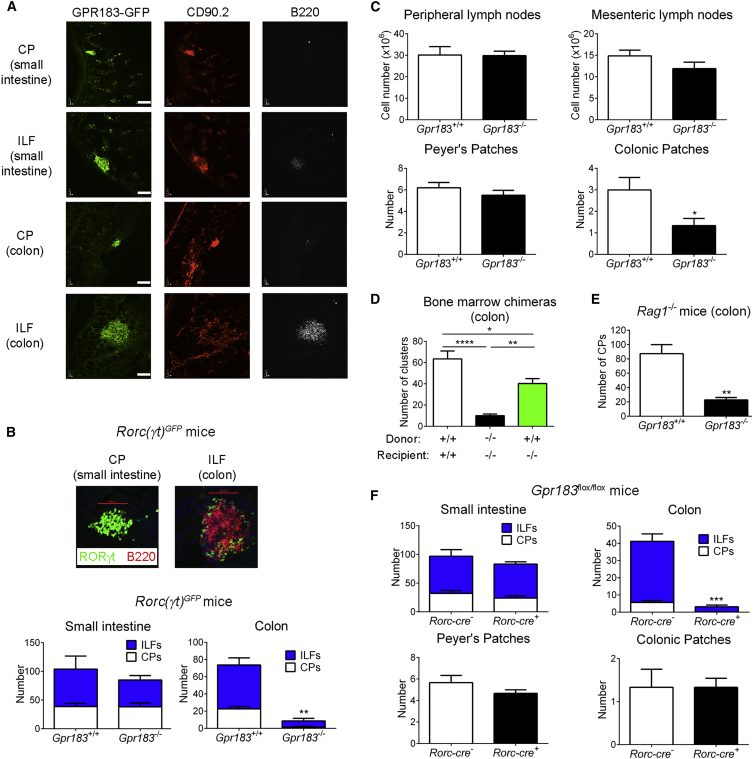
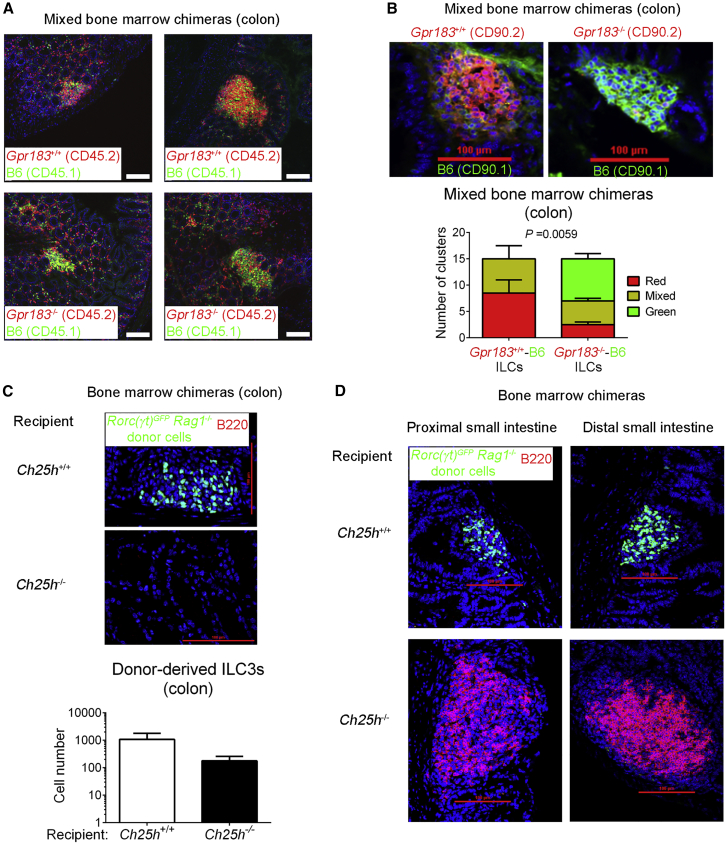
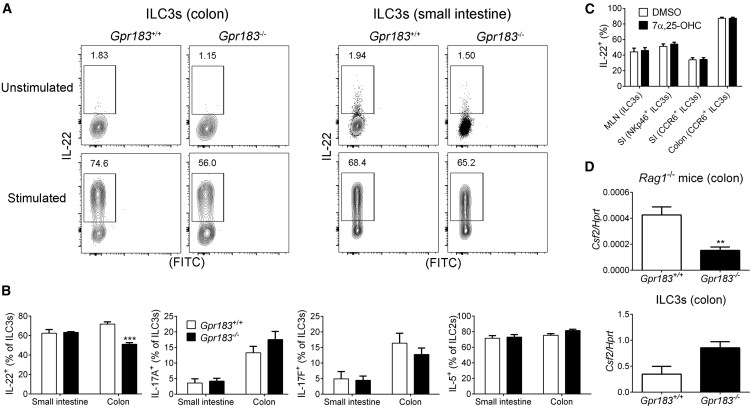
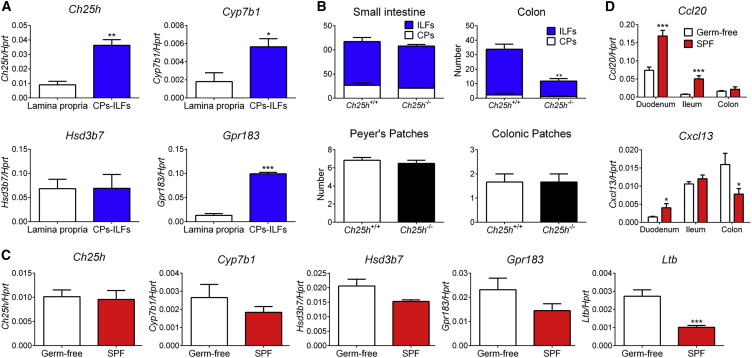
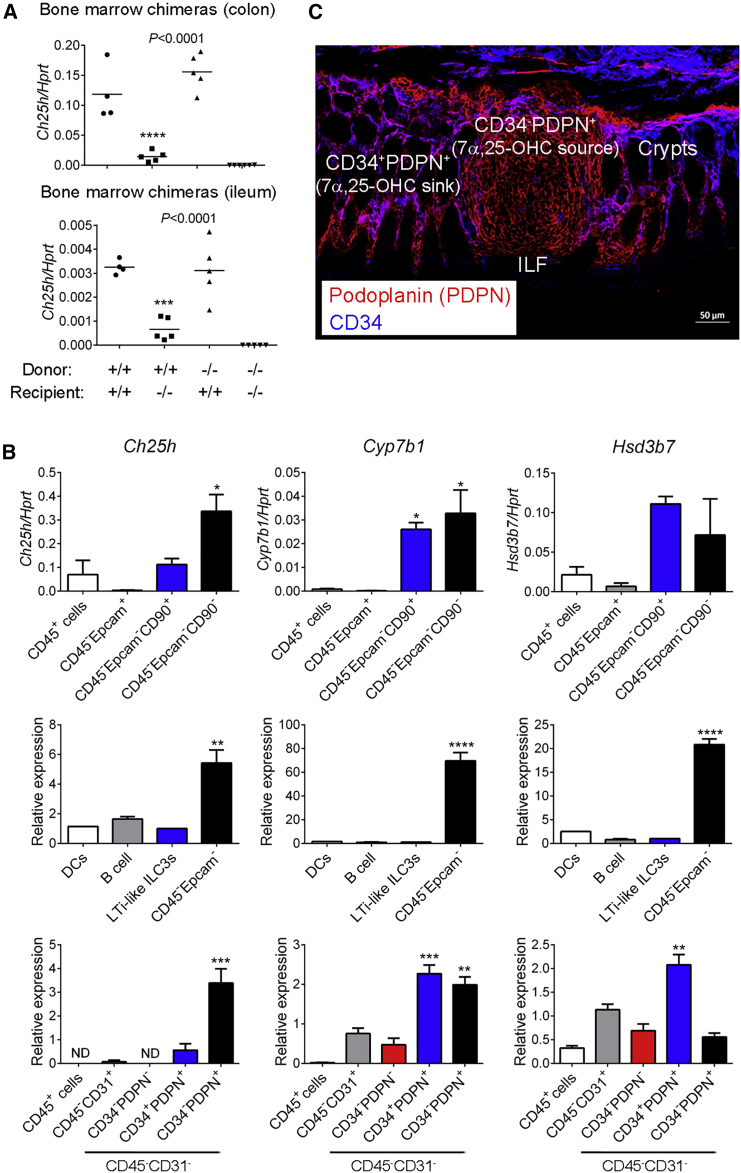
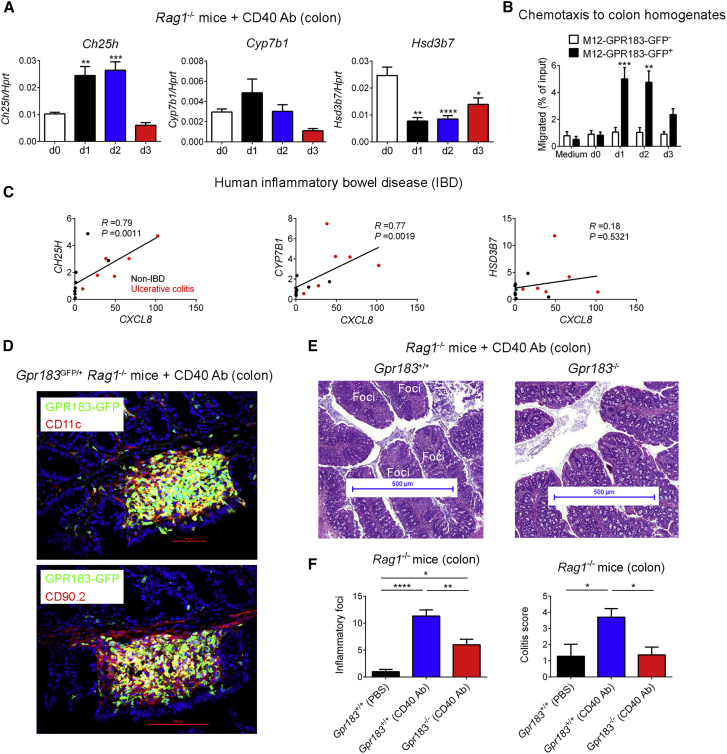
Group 3 innate lymphoid cells (ILC3s) sense environmental signals and are critical for tissue integrity in the intestine. Yet, which signals are sensed and what receptors control ILC3 function remain poorly understood. Here, we show that ILC3s with a lymphoid-tissue-inducer (LTi) phenotype expressed G-protein-coupled receptor 183 (GPR183) and migrated to its oxysterol ligand 7α,25-hydroxycholesterol (7α,25-OHC). In mice lacking Gpr183 or 7α,25-OHC, ILC3s failed to localize to cryptopatches (CPs) and isolated lymphoid follicles (ILFs). Gpr183 deficiency in ILC3s caused a defect in CP and ILF formation in the colon, but not in the small intestine. Localized oxysterol production by fibroblastic stromal cells provided an essential signal for colonic lymphoid tissue development, and inflammation-induced increased oxysterol production caused colitis through GPR183-mediated cell recruitment. Our findings show that GPR183 promotes lymphoid organ development and indicate that oxysterol-GPR183-dependent positioning within tissues controls ILC3 activity and intestinal homeostasis.

Keywords: EBI2; GPR183; cell migration; colon; inflammation; innate lymphoid cells; lymphoid tissue; oxysterols.


Figures

None
Graphical abstract
Figure 1
Figure 1
LTi-like ILC3s Highly Express GPR183 and Migrate toward 7α,25-OHC (A) Gpr183 mRNA expression in the indicated cell populations from the spleen (n = 2–6). mRNA expression was normalized to Hprt. (B) GFP expression in lamina propria B cells and ILC subsets from the colon of Gpr183GFP/+ reporter mice (green histograms) and B6 control mice (gray histograms). (C) Left panel illustrates high GPR183-GFP expression in CD4+ LTi-like ILC3s from the colon. Right panel shows mean fluorescence intensity (MFI) of GPR183-GFP expression in the indicated cell populations from (B) (n = 6). (D–F) Transwell migration of splenic LTi-like ILC3s (LinCD90.2+CD127+NK1.1) from Rag1-deficient Gpr183+/+ and Gpr183−/− mice (D), splenic B cells from B6 mice and ILC subsets from Rorc(γt)GFPRag1−/− mice (E), and colonic ILC subsets from Rag1−/− mice (F) to 7α,25-OHC (n = 2–3). Data are represented as means ± SEM. p < 0.05, ∗∗p < 0.01, ∗∗∗p < 0.001, ∗∗∗∗p < 0.0001 by one-way ANOVA with Tukey’s post-test. Data are representative of or combined from two (D and E) or three (A–C and F) experiments. See also Figures S1 and S2.
Figure 2
Figure 2
ILC3-Expressed GPR183 Is Required for the Formation of Colonic Lymphoid Tissues (A) Distribution of GFP+ cells in the small intestine and colon of Gpr183GFP/+ mice. Tissue sections were co-stained with α-CD90.2 and α-B220 Abs. Scale bars (white) represent 100 μm. (B) Number of CPs and ILFs in the small intestine and colon of Rorc(γt)GFPGpr183+/+ and Rorc(γt)GFPGpr183−/− mice (n = 3–5). The upper panel shows representative images of a CP and an ILF from Rorc(γt)GFPGpr183+/+ mice. Scale bars (red) represent 100 μm. (C) Number of peripheral and mesenteric lymph node cells (n = 6–8), Peyer’s patches (n = 10), and colonic patches (n = 3) from Gpr183+/+ and Gpr183−/− mice. (D) Number of RORγt+ clusters in the colon of bone marrow chimeras (n = 5–9). Bone marrow cells from Gpr183+/+ or Gpr183−/− mice were injected into either Gpr183+/+ or Gpr183−/− irradiated recipient mice. (E) Number of CPs in the colon of Rag1-deficient Gpr183+/+ and Gpr183−/− mice (n = 5). (F) Number of CPs, ILFs, Peyer’s patches, and colonic patches in Rorc-cre Gpr183flox/flox mice and Gpr183flox/flox or Gpr183flox/+ controls (n = 3–6). Data are represented as means ± SEM. p < 0.05, ∗∗p < 0.01, ∗∗∗p < 0.001, ∗∗∗∗p < 0.0001 by Student’s t test or one-way ANOVA with Tukey’s post-test (D). Data are representative of or combined from two (F) or three (A–E) experiments. See also Figures S3 and S4.
Figure 3
Figure 3
GPR183 and 7α,25-OHC Promote ILC3 Localization to CPs and ILFs (A) Distribution of Gpr183+/+ and Gpr183-deficient hematopoietic cells in the colon of mixed bone marrow chimeras. Bone marrow cells from Gpr183+/+ or Gpr183−/− mice (CD45.2+) were mixed 9:1 with B6 cells (CD45.1+) and injected into irradiated Rag1−/− recipients (CD45.1+) for the generation of bone marrow chimeras. Sections were stained for detection of Gpr183+/+ and Gpr183−/− cells (CD45.2, red) or B6 cells (CD45.1, green). Nuclei were visualized by DAPI staining (blue). Scale bars on the right (white) represent 100 μm. (B) Distribution of Gpr183+/+ and Gpr183-deficient ILCs in the colon of mixed bone marrow chimeras. Bone marrow cells from Gpr183+/+ or Gpr183−/− mice (CD90.2+) were mixed 9:1 with B6 cells (CD90.1+) and injected into irradiated B6 recipients (CD90.1+) for the generation of bone marrow chimeras. Colon sections were stained for detection of Gpr183+/+ and Gpr183−/− (CD90.2, red) or B6 (CD90.1, green) ILCs. Scale bars (red) represent 100 μm. The lower panel shows the number of clusters in Gpr183+/+-B6 and Gpr183−/−-B6 chimeras consisting of CD90.2+ (red) or CD90.1+ (green) ILCs. Data are represented as means ± SEM. p value by two-way ANOVA. (C and D) Distribution of donor-derived ILC3s (RORγt-GFP+, green) in the colon (C) and small intestine (D) of bone marrow chimeras. Bone marrow cells from Rag1-deficient Rorc(γt)GFP transgenic mice were injected into irradiated Ch25h+/+ or Ch25h−/− recipients for the generation of bone marrow chimeras. Sections were co-stained for detection of B cells (B220+, red). Scale bars (red) represent 100 μm. The lower panel in (C) shows the number of donor-derived ILC3s in the colon of Ch25h+/+ or Ch25h−/− hosts. Data are representative of or combined from two (B–D) or three (A) experiments. See also Figure S5.
Figure 4
Figure 4
GPR183 Enhances IL-22 Production by Colonic ILC3s (A) IL-22 production by ILC3s from the colon or small intestine of Gpr183+/+ and Gpr183−/− mice. Numbers indicate cell frequencies. (B) Frequency of intestinal ILC3s producing IL-17A, IL-17F, and IL-22 and frequency of ILC2s producing IL-5 from Gpr183+/+ and Gpr183−/− mice (n = 3–4). (C) Frequency of IL-22-producing ILC3s from mesenteric lymph nodes (MLN), small intestine (SI), and colon of B6 mice after stimulation with IL-1β and IL-23 in the presence of solvent control dimethyl sulfoxide (DMSO) or 10 nM 7α,25-OHC (n = 10). (D) Csf2 mRNA expression in the colon (top; n = 8–9) or in sorted colonic ILC3s (bottom; n = 2) from Gpr183+/+ and Gpr183−/− mice on a Rag1-deficient background. mRNA expression was normalized to Hprt. Data are represented as means ± SEM. ∗∗p < 0.01, ∗∗∗p < 0.001 by Student’s t test. Data are representative of or combined from two experiments. See also Figure S6.
Figure 5
Figure 5
Microbiota-Independent Local 7α,25-OHC Production Is Necessary for Colonic CP and ILF Formation (A) Ch25h, Cyp7b1, Hsd3b7, and Gpr183 mRNA expression in the colon of human CD2GFP transgenic mice (n = 3). mRNA expression was compared in micro-dissected CPs and ILFs (CPs-ILFs) versus micro-dissected lamina propria. (B) Number of CPs, ILFs, Peyer’s patches, and colonic patches in Ch25h+/+ and Ch25h−/− mice (n = 3–6). (C) Ch25h, Cyp7b1, Hsd3b7, Gpr183, and Ltb mRNA expression in the colon of germ-free and specific-pathogen-free (SPF) mice (n = 6). (D) Ccl20 and Cxcl13 mRNA expression in the intestine of germ-free and SPF mice (n = 6). Data are represented as means ± SEM. p < 0.05, ∗∗p < 0.01, ∗∗∗p < 0.001 by Student’s t test. Data are representative of or combined from two experiments. See also Figure S7.
Figure 6
Figure 6
Fibroblastic Stromal Cells Provide a Source of 7α,25-OHC (A) Ch25h mRNA expression in the colon and ileum of bone marrow chimeras (n = 4–6). Chimeras were generated with Ch25h+/+ and Ch25h−/− mice as bone marrow donors and recipients as indicated. (B) Ch25h, Cyp7b1, and Hsd3b7 mRNA expression in the indicated purified cell populations from the colon of B6 mice (n = 1–7). (C) Immunofluorescence microscopy of colon sections from B6 mice were stained with Abs against podoplanin (PDPN) (red) and CD34 (blue). Scale bar represents 50 μm. Data are represented as means ± SEM. p < 0.05, ∗∗p < 0.01, ∗∗∗p < 0.001, ∗∗∗∗p < 0.0001 by one-way ANOVA with Tukey’s post-test. Data are representative of or combined from two or three experiments. See also Figure S7.
Figure 7
Figure 7
GPR183 Expressed on Innate Immune Cells Promotes Colitis (A) Colonic Ch25h, Cyp7b1, and Hsd3b7 mRNA expression in Rag1−/− mice injected with 100 μg CD40 Ab (n = 6–7). d, day. (B) Transwell migration of GPR183-transduced B cell line (M12-GPR183-GFP) to colon homogenates from CD40-Ab-treated Rag1−/− mice (n = 4). Chemotaxis of GFP M12 cells was used as a negative control. (C) Correlation of CH25H, CYP7B1, and HSD3B7 with CXCL8 mRNA expression in the colon of healthy controls (black dots; n = 8) and patients with ulcerative colitis (red dots; n = 6). (D) Immunofluorescence microscopy of proximal colon from Rag1-deficient Gpr183GFP/+ mice 7 days after CD40 Ab injection. Sections were co-stained for detection of nuclei (DAPI) and myeloid cells (CD11c) or ILCs (CD90.2). Inflammatory foci are shown. Scale bars (red) represent 100 μm. (E) H&E staining of proximal colon from Rag1-deficient Gpr183+/+ and Gpr183−/− mice 7 days after CD40 Ab treatment. Inflammatory foci at the tip of colonic folds are indicated. Scale bars (blue) represent 500 μm. (F) Number of inflammatory foci and colitis score in CD40-Ab-treated Gpr183+/+Rag1−/− and Gpr183−/−Rag1−/− mice (n = 7–15). PBS-treated Gpr183+/+Rag1−/− mice were used as controls. Data are represented as means ± SEM. p < 0.05, ∗∗p < 0.01, ∗∗∗p < 0.001, ∗∗∗∗p < 0.0001 by one-way ANOVA with Tukey’s post-test. Data are representative of or combined from two experiments.

References

    1. Artis D., Spits H. The biology of innate lymphoid cells. Nature. 2015;517:293–301. - PubMed
    1. Bando J.K., Liang H.E., Locksley R.M. Identification and distribution of developing innate lymphoid cells in the fetal mouse intestine. Nat. Immunol. 2015;16:153–160. - PMC - PubMed
    1. Buettner M., Lochner M. Development and Function of Secondary and Tertiary Lymphoid Organs in the Small Intestine and the Colon. Front. Immunol. 2016;7:342. - PMC - PubMed
    1. Buonocore S., Ahern P.P., Uhlig H.H., Ivanov I.I., Littman D.R., Maloy K.J., Powrie F. Innate lymphoid cells drive interleukin-23-dependent innate intestinal pathology. Nature. 2010;464:1371–1375. - PMC - PubMed
    1. Cyster J.G., Dang E.V., Reboldi A., Yi T. 25-Hydroxycholesterols in innate and adaptive immunity. Nat. Rev. Immunol. 2014;14:731–743. - PubMed

Publication types

MeSH terms