. 2018 Mar;208(3):1261-1274.
doi: 10.1534/genetics.118.300711. Epub 2018 Jan 17.

A Population Phylogenetic View of Mitochondrial Heteroplasmy

Affiliations

A Population Phylogenetic View of Mitochondrial Heteroplasmy

Peter R Wilton et al. Genetics. 2018 Mar.

Abstract

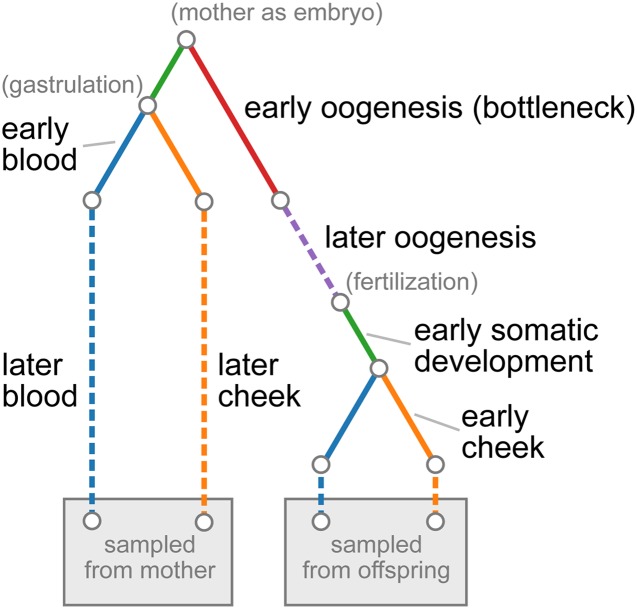
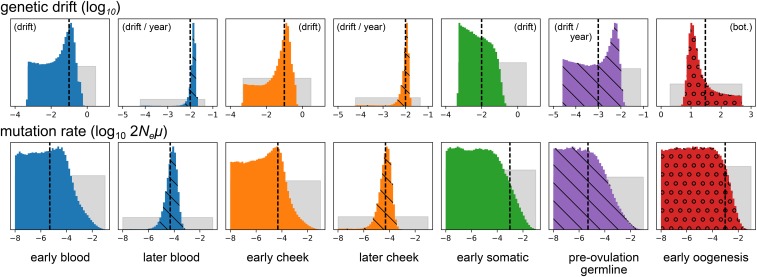
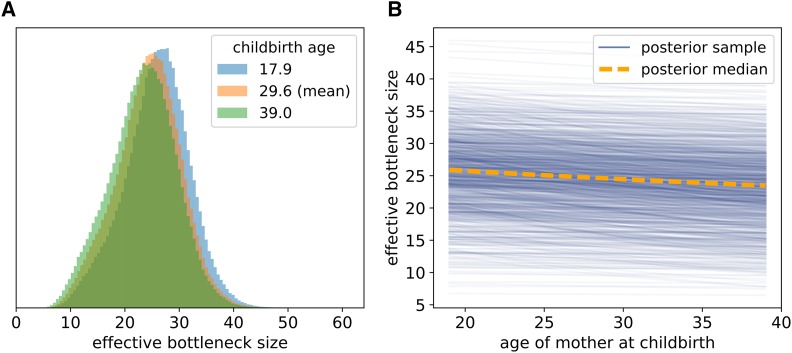
The mitochondrion has recently emerged as an active player in myriad cellular processes. Additionally, it was recently shown that >200 diseases are known to be linked to variants in mitochondrial DNA or in nuclear genes interacting with mitochondria. This has reinvigorated interest in its biology and population genetics. Mitochondrial heteroplasmy, or genotypic variation of mitochondria within an individual, is now understood to be common in humans and important in human health. However, it is still not possible to make quantitative predictions about the inheritance of heteroplasmy and its proliferation within the body, partly due to the lack of an appropriate model. Here, we present a population-genetic framework for modeling mitochondrial heteroplasmy as a process that occurs on an ontogenetic phylogeny, with genetic drift and mutation changing heteroplasmy frequencies during the various developmental processes represented in the phylogeny. Using this framework, we develop a Bayesian inference method for inferring rates of mitochondrial genetic drift and mutation at different stages of human life. Applying the method to previously published heteroplasmy frequency data, we demonstrate a severe effective germline bottleneck comprised of the cumulative genetic drift occurring between the divergence of germline and somatic cells in the mother, and the separation of germ layers in the offspring. Additionally, we find that the two somatic tissues we analyze here undergo tissue-specific bottlenecks during embryogenesis, less severe than the effective germline bottleneck, and that these somatic tissues experience little additional genetic drift during adulthood. We conclude with a discussion of possible extensions of the ontogenetic phylogeny framework and its possible applications to other ontogenetic processes in addition to mitochondrial heteroplasmy.

Keywords: cell lineage; development; phylogeny; somatic evolution.


Figures

Figure 1
Figure 1
Ontogenetic phylogeny for sampled tissues in mother-child duos from Rebolledo-Jaramillo et al. (2014). Each color represents a different tissue or developmental process. The leaves of the tree represent the blood and cheek epithelial tissues sampled from the mother and her child. Solid lines show processes modeled by a fixed amount of genetic drift and dashed lines show processes in which genetic drift accumulates linearly with age. The red component, representing early oogenesis, models a single-generation bottleneck with subsequent doubling of the population size back up to a large size. Parenthetical descriptions in gray show the timing of notable developmental events.
Figure 2
Figure 2
Posterior distributions of genetic drift and mutation parameters inferred from data simulated under the model assumed by the inference procedure. The top and bottom rows depict genetic drift and mutation rate parameters, respectively. Gray distributions depict prior distributions, and colored distributions depict posterior distributions. Colors match the colors of the ontogenetic processes in Figure 1. Distributions hashed with diagonal lines correspond to processes with drift parameterized by rates of accumulation of genetic drift with age. (That is, they correspond to the dashed lines in Figure 1.) The circles in the red posterior distributions indicate that this process is modeled by an explicit bottleneck. All parameters are log10-transformed, and the distributions correspond to these transformed variables. Vertical dashed lines show the simulated parameter values. Not shown are the two parameters controlling the allele frequency distribution at the root of the phylogeny, which were inferred with comparable accuracy.
Figure 3
Figure 3
Inference results for real heteroplasmy frequency data. The top row shows results for genetic drift parameters, and the bottom row shows posterior distributions for scaled mutation rates. Distributions hashed with diagonal lines correspond to processes with drift parameterized by rates of accumulation of genetic drift with age. (That is, they correspond to the dashed lines in Figure 1.) The circles in the red posterior distributions indicate that this process is modeled by an explicit bottleneck. All parameters are log10-transformed, and the depicted distributions correspond to these transformed variables. Distributions are not drawn to a common vertical axis.
Figure 4
Figure 4
Posterior samples of the EBS for mothers of different ages. (A) Posterior distribution of the effective, between-generation, bottleneck size for younger, older, and median-aged mothers. (B) Relationship between mother’s age at childbirth and the EBS. The orange dashed line shows how the median EBS varies with age at childbirth. The solid blue lines show posterior samples from the relationship between EBS and age at childbirth, with each having the form of (C.4), where the genetic drift parameters in this equation are jointly sampled from the posterior distribution. A total of n=1000 lines sampled from the posterior are plotted. We note that each line necessarily decreases with mother birth age due to our assumption that genetic drift accumulates at some rate in the oocyte [see (C.4)]; what varies from one line to another is the rate at which the EBS decreases due to this accumulation of genetic drift.
Figure 5
Figure 5
Quantile-quantile comparison of real heteroplasmy data from Rebolledo-Jaramillo et al. (2014) and data simulated under maximum a posteriori parameter estimates inferred from this data. (A) compares marginal distributions of allele frequencies in each tissue, and (B) compares distributions of absolute differences in allele frequency between tissues. Each dot represents a sequential percentile of the distributions being compared. Following Rebolledo-Jaramillo et al. (2014), alleles were polarized such that the minor allele in the mother (averaged across her two tissues) was denoted as the focal allele.

References

    1. Boisset J.-C., Robin C., 2012. On the origin of hematopoietic stem cells: progress and controversy. Stem Cell Res. 8: 1–13. - PubMed
    1. Burgstaller J., Johnston I., Jones N., Albrechtová J., Kolbe T., et al. , 2014. mtDNA segregation in heteroplasmic tissues is common in vivo and modulated by haplotype differences and developmental stage. Cell Rep. 7: 2031–2041. - PMC - PubMed
    1. Cao L., Shitara H., Horii T., Nagao Y., Imai H., et al. , 2007. The mitochondrial bottleneck occurs without reduction of mtDNA content in female mouse germ cells. Nat. Genet. 39: 386–390. - PubMed
    1. Carling P. J., Cree L. M., Chinnery P. F., 2011. The implications of mitochondrial DNA copy number regulation during embryogenesis. Mitochondrion 11: 686–692. - PubMed
    1. Carlson B. M., 2014. Human Embryology and Developmental Biology, Ed. 5. Elsevier, Philadelphia.

Publication types