. 2018 Jan;30(1):134-152.
doi: 10.1105/tpc.17.00626. Epub 2018 Jan 17.

Canonical and Noncanonical Actions of Arabidopsis Histone Deacetylases in Ribosomal RNA Processing

Affiliations

Canonical and Noncanonical Actions of Arabidopsis Histone Deacetylases in Ribosomal RNA Processing

Xiangsong Chen et al. Plant Cell. 2018 Jan.

Abstract

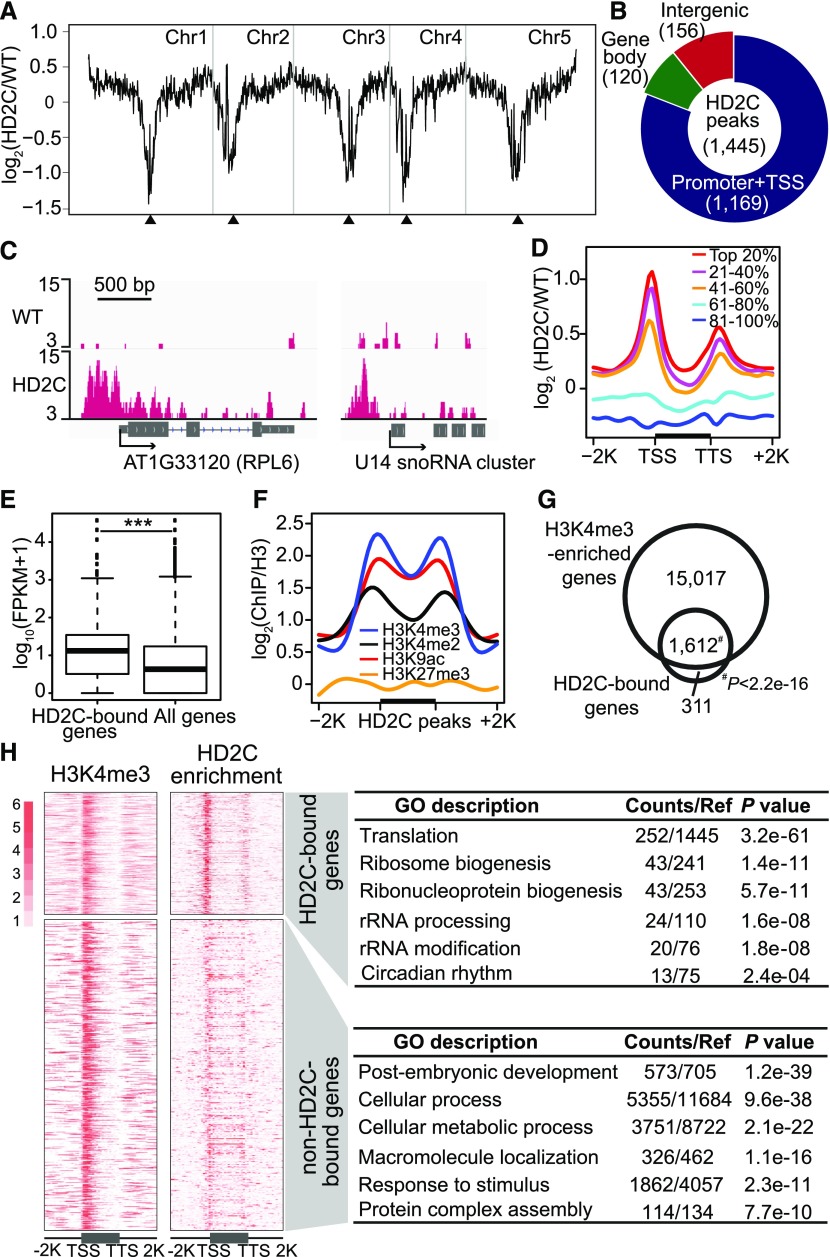
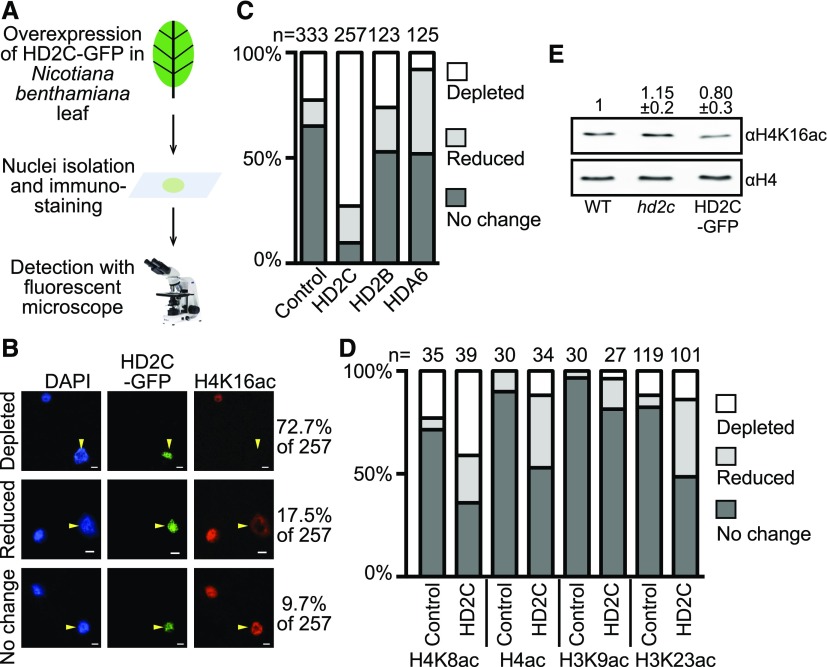
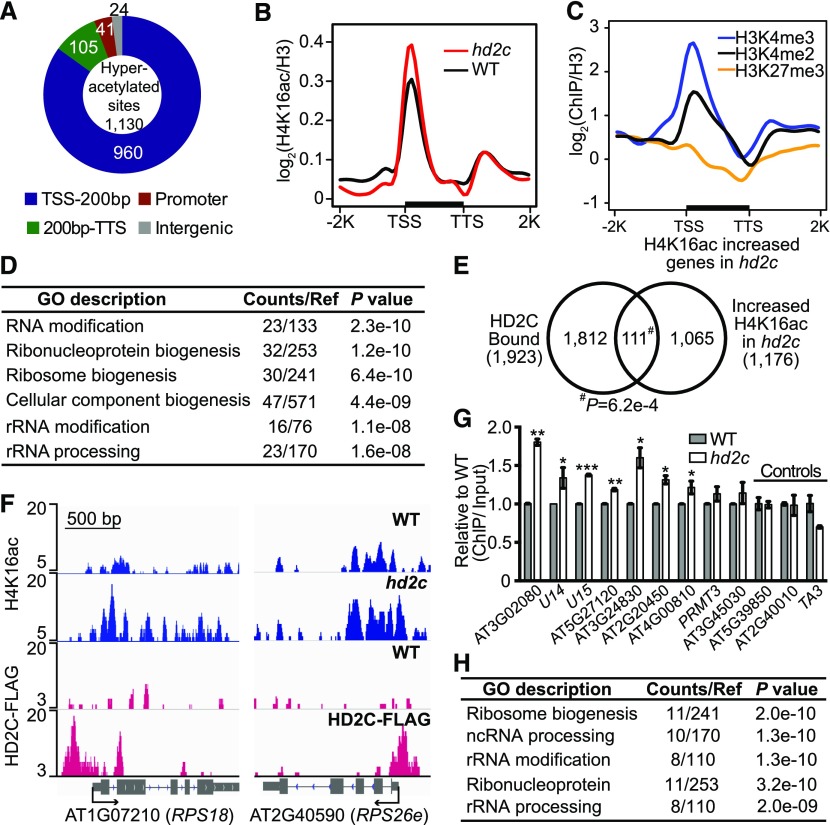
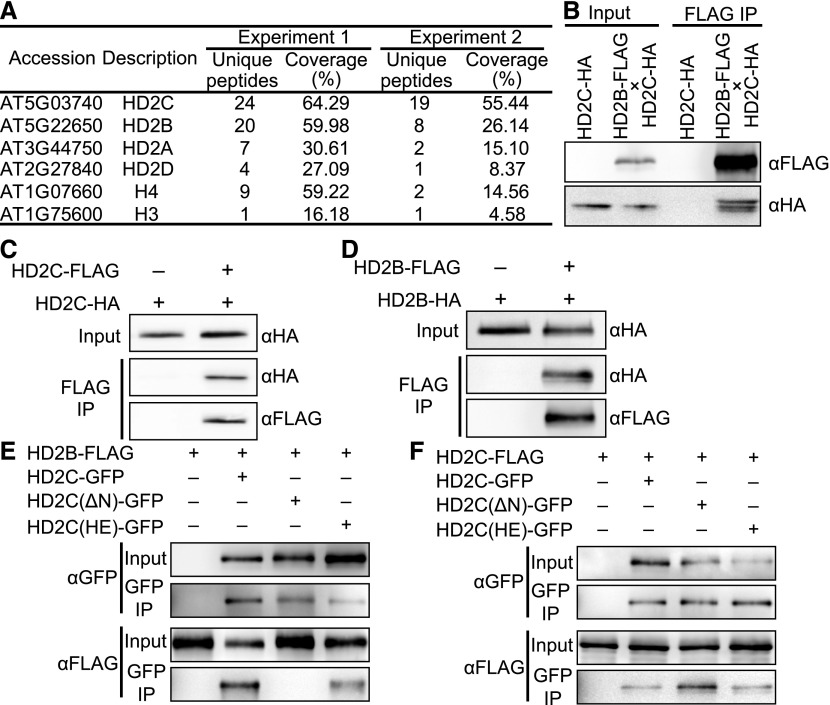
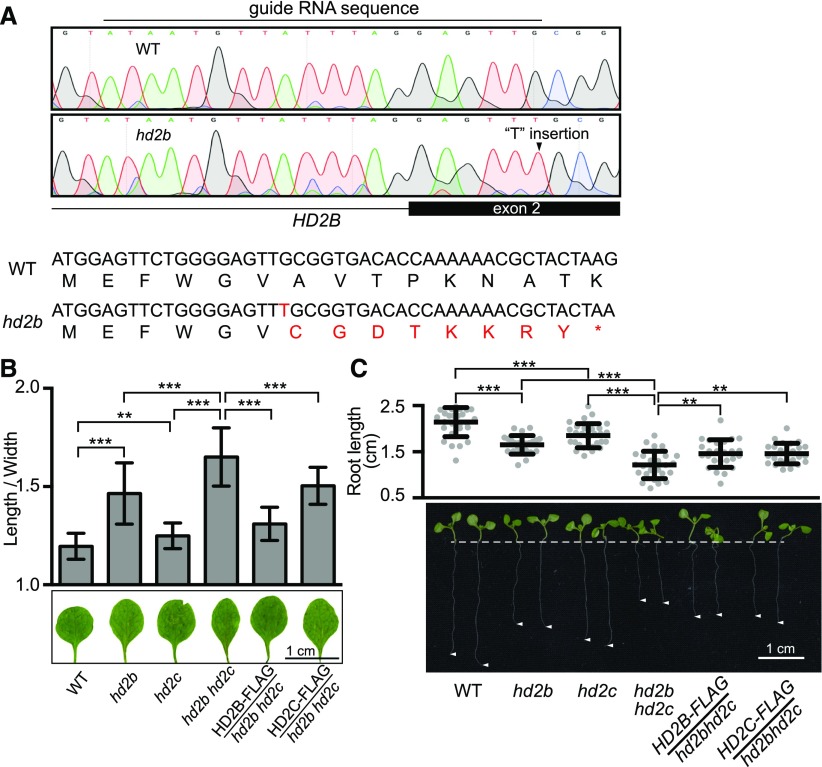
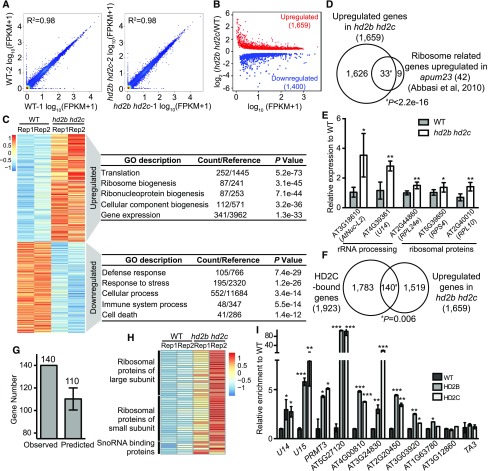
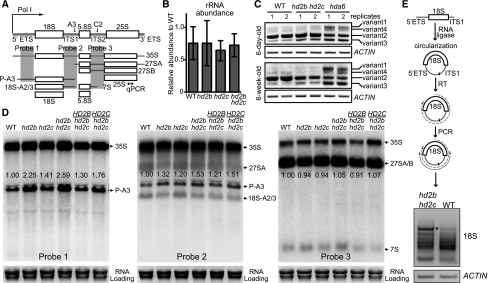
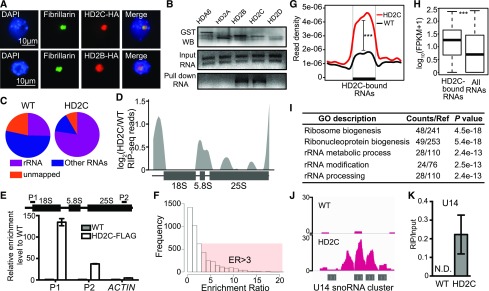
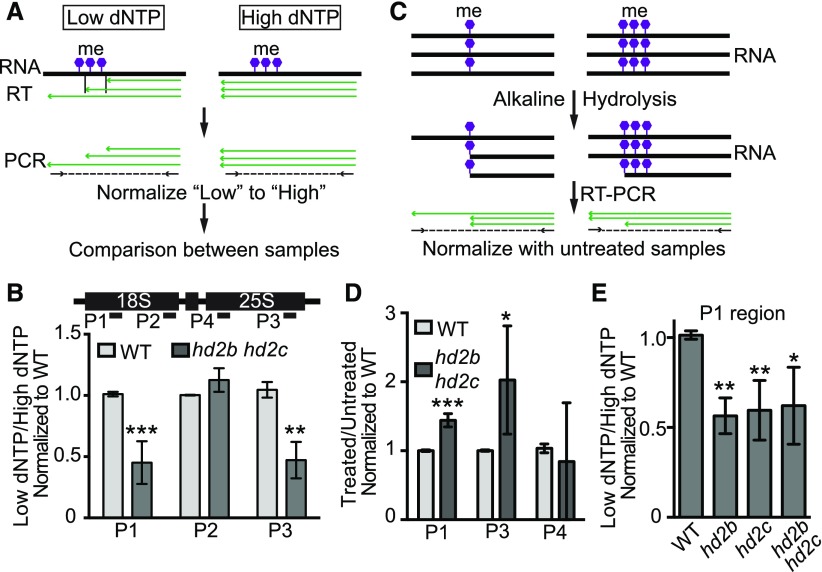
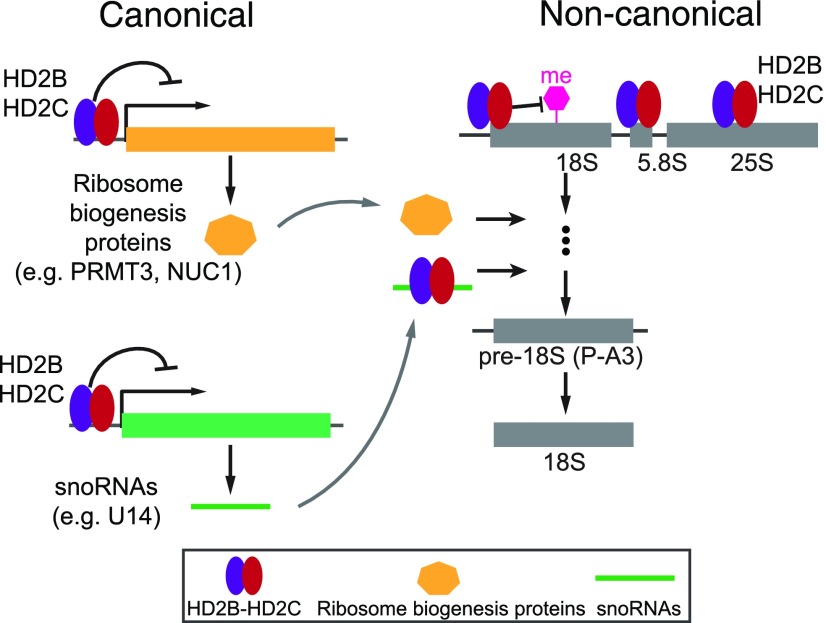
Ribosome biogenesis is a fundamental process required for all cellular activities. Histone deacetylases play critical roles in many biological processes including transcriptional repression and rDNA silencing. However, their function in pre-rRNA processing remains poorly understood. Here, we discovered a previously uncharacterized role of Arabidopsis thaliana histone deacetylase HD2C in pre-rRNA processing via both canonical and noncanonical manners. HD2C interacts with another histone deacetylase HD2B and forms homo- and/or hetero-oligomers in the nucleolus. Depletion of HD2C and HD2B induces a ribosome-biogenesis deficient phenotype and aberrant accumulation of 18S pre-rRNA intermediates. Our genome-wide analysis revealed that HD2C binds and represses the expression of key genes involved in ribosome biogenesis. Using RNA immunoprecipitation and sequencing, we further uncovered a noncanonical mechanism of HD2C directly associating with pre-rRNA and small nucleolar RNAs to regulate rRNA methylation. Together, this study reveals a multifaceted role of HD2C in ribosome biogenesis and provides mechanistic insights into how histone deacetylases modulate rRNA maturation at the transcriptional and posttranscriptional levels.


Figures

Figure 1.
Figure 1.
HD2C Binds Promoters of Active Genes Involved in Ribosome Biogenesis. (A) Chromosomal view of HD2C binding. The y axis represents the log2 value of HD2C ChIP-seq reads relative to those of untagged wild-type control; Chr1 to Chr5 represent five chromosomes; black triangles indicate positions of centromeres. (B) Genomic distribution of HD2C binding peaks. (C) Representative snapshots of HD2C binding to gene promoters. (D) Metaplots of HD2C ChIP-seq reads over genes. All Arabidopsis genes were divided evenly into five groups based on their expression level in the wild type. Top 20% indicates the 20% genes with highest expression level, and 81 to 100% indicates the 20% genes with lowest expression level. The y axis represents the log2 value of HD2C-FLAG ChIP-seq reads relative to those of untagged wild-type control. (E) Box plot of expression levels of genes bound by HD2C and all genes in the genome. (F) Metaplots of histone modification levels over HD2C binding peaks. Black bar in the x axis represents the HD2C binding peaks; y axis represents the levels of histone modifications normalized with H3; −2K and +2K represent 2 kb upstream and downstream of HD2C binding peaks, respectively. (G) Venn diagram of overlap between HD2C-bound genes and H3K4me3-enriched genes. (H) Heat maps of HD2C-bound genes and H3K4me3-enriched genes and their functional enrichment. TSS, transcription start site; TTS, transcription terminal site. −2K and +2K represent 2 kb upstream of TSS and 2 kb downstream of transcription terminal site, respectively.
Figure 2.
Figure 2.
Overexpression of HD2C Results in H4K16 Hypoacetylation in N. benthamiana. (A) Schematic diagram of detecting HD2C-induced histone acetylation change in N. benthamiana. (B) Immunostaining with H4K16ac antibody in nuclei overexpressing HD2C-GFP. Arrows represent the transfected nuclei expressing HD2C-GFP. Bar = 10 μm. (C) Quantification of H4K16ac immunostaining performed with HD2C-GFP, HD2B-GFP, and HDA6-GFP. Numbers at the top represent the number of nuclei counted for each experiment. (D) Quantification of immunostaining performed with HD2C-GFP with other histone acetylation antibodies. Numbers at the top represent the number of nuclei counted for each experiment. (E) Detection of histone acetylation levels in hd2c mutant and HD2C overexpression (HD2C-GFP) plants by immunoblots. Numbers represent average band intensity of five technical immunoblot repeats (mean ± sd) normalized to H4.
Figure 3.
Figure 3.
Depletion of HD2C Results in H4K16ac Hyperacetylation at Ribosomal Genes in Arabidopsis. (A) Genomic distribution of H4K16 hyperacetylated peaks in hd2c. TSS-200bp represents transcription start site and its 200 bp downstream region; 200bp-TTS represents the rest gene region and transcription terminal site. (B) Metaplots of H4K16ac over genes in the wild type and hd2c. TSS, transcription start site; TTS, transcription terminal site. −2K and +2K represent 2 kb upstream of TSS and 2 kb downstream of TTS, respectively. y axis represents the log2 value of H4K16ac ChIP-seq reads normalized with H3 ChIP-seq reads. (C) Metaplots of histone marks on H4K16ac increased genes in hd2c. y axis represents log2 values ChIP-seq reads of histone marks normalized with those of H3. (D) GO analysis of genes with increased H4K16ac in hd2c. (E) Venn diagram of HD2C-bound genes and H4K16ac increased genes in hd2c. P value was calculated with Fisher’s exact test. (F) Representative snapshots of HD2C occupancy and H4K16ac levels over genes selected from the overlapped group in (E). (G) Validation of H4K16 hyperacetylation at genes selected from the overlapped group in (E). ChIP-qPCR value was normalized with input and then the wild type was set as 1. Data are represented as mean ± sd with two biological replicates. Two loci (AT5G39850 and AT2G40010) that did not show increased H4K16ac in hd2c and a transposon TA3 were used as negative control. Student’s t test, *P < 0.05, **P < 0.01, and ***P < 0.001. (H) GO analysis of genes showed both HD2C binding and increased H4K16ac in hd2c.
Figure 4.
Figure 4.
HD2C Interacts with HD2B and Forms Homo-Oligomer. (A) List of partial proteins copurified with HD2C-FLAG. “Unique peptides” indicates the number of identified peptides that are mapped to only one protein. “Coverage” indicates the percentage of the protein covered by unique peptides identified in this experiment. (B) Co-IP of HD2C and HD2B using Arabidopsis F1 plants expressing both HD2C-HA and HD2B-FLAG. (C) Co-IP of HD2C-FLAG and HD2C-HA in N. benthamiana. (D) Co-IP of HD2B-FLAG and HD2B-HA in N. benthamiana. (E) Co-IP between GFP tagged HD2C mutants and wild-type HD2B-FLAG in N. benthamiana. (F) Co-IP between GFP tagged HD2C mutants and wild-type HD2C-FLAG in N. benthamiana.
Figure 5.
Figure 5.
Depletion of HD2C and HD2B Causes Ribosome-Related Developmental Pleiotropy. (A) Schematic diagram of loss-of-function hd2b mutant generated with a CRISPR-cas9 system. (B) Length/width ratio of the first two true leaves of the wild type, hd2b, hd2c, hd2b hd2c double mutant, HD2B-FLAG/hd2b hd2c, and HD2C-FLAG/hd2b hd2c. Data are represented as mean ± sd with at least 30 leaves. Student’s t test, ** P < 0.01 and ***P < 0.001. (C) Root length of plants in (A). Data are represented as mean ± sd with at least 20 plants. Student’s t test, **P < 0.01 and ***P < 0.001.
Figure 6.
Figure 6.
HD2C and HD2B Directly Repress Expression of Ribosome Biogenesis-Related Genes. (A) Scatterplots for two RNA-seq biological replicates of the wild type and hd2b hd2c. Expression level was calculated by log10 (FPKM+1). (B) Scatterplot of differentially expressed genes in hd2b hd2c double mutant. Red dots and blue dots represent upregulated and downregulated genes, respectively. x axis represents the expression level of genes in the wild type by calculating log10 value of FPKM+1. y axis represents the log2 value of gene expression level in hd2b hd2c relative to the wild type. FPKM, fragments per kilobase of transcript per million mapped reads. (C) Heat maps of differentially expressed genes in two biological replicates of the wild type and hd2b hd2c and their functional enrichment. Color bar indicates the Z-score. Rep1 and Rep2 represent two replicates. (D) Venn diagram of ribosome biogenesis genes upregulated in apum23 and hd2b hd2c. (E) RT-qPCR validation of upregulation of overlapped genes in (D). y axis represents the relative expression level to the wild type. Data are represented as mean ± sd from two biological replicates. Student’s t test, *P < 0.05 and **P < 0.01. (F) Venn diagram of HD2C-bound genes and upregulated genes in hd2b hd2c. P value was calculated with Fisher’s exact test. (G) Relative enrichments of the observed number of overlapped genes between HD2C binding and upregulation in hd2b hd2c compared with the average overlapped genes by 10,000 genome-shuffling experiments. (H) Heat maps of expression of ribosome biogenesis genes identified from the 140 genes in (F) in the wild type and hd2b hd2c. Color bar indicates the Z-score. (I) ChIP-qPCR validation of HD2B and HD2C association with ribosome biogenesis genes selected from overlapped genes in (F). Data are represented as mean ± sd from two biological replicates. Student’s t test, *P < 0.05, **P <0 .01, and ***P < 0.001. Transposable element TA3 served as a negative control.
Figure 7.
Figure 7.
HD2C and HD2B Promote Pre-18S rRNA Processing. (A) Schematic diagram of rRNA transcription and processing in Arabidopsis. Bidirectional arrow represents the position of the primer used in (B). Probes 1 to 3 represent the positions of the probes used in (D). (B) RT-qPCR of total rRNA abundance in the wild type, hd2b, hd2c, and hd2b hd2c double mutant. y axis represents the relative transcript level. (C) RT-PCR detection of four major rRNA transcripts in the wild type, hd2b hd2c, and hda6 in different stages of plants. (D) RNA gel blots with probes listed in (A). Ethidium bromide staining of mature rRNA as a loading control. Numbers besides the band indicate the relative density of the bands normalized to the loading control. (E) Circularized RT-PCR for pre-18S rRNA in the wild type and hd2b hd2c. RT was performed with 18S rRNA-specific primer toward 5′ETS. The joint end between 5′ and 3′ of 18S rRNA was amplified in the wild type and hd2b hd2c. The most abundant band in hd2b hd2c compared with the wild type (indicated with an asterisk) was cloned into plasmid and sequenced. ACTIN served as an internal control.
Figure 8.
Figure 8.
HD2C Is Associated with Pre-rRNAs and SnoRNAs. (A) Immunostaining for protein localization of HD2C and HD2B. Fibrillarin was used as a nucleolar marker. (B) In vitro RNA pull-down assay of HD2C and HD2B. Bands in “GST WB” indicate immunoblots of GST-tagged protein. Bands in “Input RNA” and “Pull down RNA” indicate ethidium bromide staining of rRNA. (C) Distribution of RIP-seq reads of HD2C and the wild type. rRNA represents the reads mapped to rRNA sequence, and non-rRNA represents reads mapped to other RNAs except rRNA. (D) HD2C binding peaks on rRNA precursor. y axis represents the log2 value of HD2C RIP-seq normalized with the wild type. (E) RIP-qPCR confirmation of HD2C binding on rRNA. ACTIN served as a control. (F) Histogram of frequency distribution of HD2C enrichment ratio on RNAs. ER, enrichment ratio. (G) Metaplots of HD2C enrichment on HD2C-bound RNAs. y axis represents the read density of RIP-seq. Student’s t test, ***P < 0.001. (H) Box plots show the abundance of HD2C-bound RNAs and average of all RNAs. y axis represents the log10 value of FPKM+1. Student’s t test, ***P < 0.001. (I) GO analysis of HD2C-bound RNAs. (J) Snapshot of HD2C binding peaks on U14 snoRNA cluster RNA transcript. (K) RIP-qPCR validation of HD2C binding on U14 snoRNA. N.D., not detected.
Figure 9.
Figure 9.
HD2C and HD2B Repress RNA Methylation. (A) Schema diagram of RNA methylation assay using low dNTP method. (B) RT-qPCR amplification with 18S and 25S rRNA specific primers in the wild type and hd2b hd2c double mutant using method presented in (A). Lower value indicates higher methylation level. (C) Schema diagram of RNA methylation assay using alkaline hydrolysis method. (D) RT-qPCR amplification with 18S and 25S rRNA specific primers in the wild type and hd2b hd2c double mutant using method presented in (C). Higher value indicates higher methylation level. Primer positions were shown in (B). (E) RT-qPCR amplification with 18S rRNA specific primer in the wild type, hd2b and hd2c single mutants, and hd2b hd2c double mutant using method presented in (A). Lower value indicates higher methylation level. Primer position was shown in (B). All data are represented as mean ± sd with at least four biological replicates. Student’s t test, *P < 0.05, **P < 0.01, and ***P < 0.001.
Figure 10.
Figure 10.
A Working Model for Canonical and Noncanonical Mechanisms of HD2C and HD2B in rRNA Processing. HD2C and HD2B form complex and drive pre-rRNA processing and ribosome biogenesis via a canonical and/or noncanonical pathway. On the one hand, HD2C and HD2B directly bind and repress the expression of key genes required for ribosome biogenesis, including ribosome biogenesis proteins (e.g., PRMT3 and/or NUC1) and snoRNAs (e.g., U14). On the other hand, HD2C and HD2B are associated with pre-rRNA and snoRNAs to regulate rRNA modifications (e.g., methylation) and pre-rRNA processing.

References

    1. Abbasi N., Kim H.B., Park N.I., Kim H.S., Kim Y.K., Park Y.I., Choi S.B. (2010). APUM23, a nucleolar Puf domain protein, is involved in pre-ribosomal RNA processing and normal growth patterning in Arabidopsis. Plant J. 64: 960–976. - PubMed
    1. Ali S.A., Dobson J.R., Lian J.B., Stein J.L., van Wijnen A.J., Zaidi S.K., Stein G.S. (2012). A RUNX2-HDAC1 co-repressor complex regulates rRNA gene expression by modulating UBF acetylation. J. Cell Sci. 125: 2732–2739. - PMC - PubMed
    1. Anantharaman V., Koonin E.V., Aravind L. (2002). SPOUT: a class of methyltransferases that includes spoU and trmD RNA methylase superfamilies, and novel superfamilies of predicted prokaryotic RNA methylases. J. Mol. Microbiol. Biotechnol. 4: 71–75. - PubMed
    1. Aravind L., Koonin E.V. (1998). Second family of histone deacetylases. Science 280: 1167a.
    1. Bachand F. (2007). Protein arginine methyltransferases: from unicellular eukaryotes to humans. Eukaryot. Cell 6: 889–898. - PMC - PubMed

Publication types

MeSH terms