. 2018 Mar 9;293(10):3637-3650.
doi: 10.1074/jbc.M117.817635. Epub 2018 Jan 17.

TRPM2 channel-mediated regulation of autophagy maintains mitochondrial function and promotes gastric cancer cell survival via the JNK-signaling pathway

Affiliations

TRPM2 channel-mediated regulation of autophagy maintains mitochondrial function and promotes gastric cancer cell survival via the JNK-signaling pathway

Shekoufeh Almasi et al. J Biol Chem. .

Abstract

A lack of effective treatment is one of the main factors contributing to gastric cancer-related death. Discovering effective targets and understanding their underlying anti-cancer mechanism are key to achieving the best response to treatment and to limiting side effects. Although recent studies have shown that the cation channel transient receptor potential melastatin-2 (TRPM2) is crucial for cancer cell survival, the exact mechanism remains unclear, limiting its therapeutic potential. Here, using molecular and functional assays, we investigated the role of TRPM2 in survival of gastric cancer cells. Our results indicated that TRPM2 knockdown in AGS and MKN-45 cells decreases cell proliferation and enhances apoptosis. We also observed that the TRPM2 knockdown impairs mitochondrial metabolism, indicated by a decrease in basal and maximal mitochondrial oxygen consumption rates and ATP production. These mitochondrial defects coincided with a decrease in autophagy and mitophagy, indicated by reduced levels of autophagy- and mitophagy-associated proteins (i.e. ATGs, LC3A/B II, and BNIP3). Moreover, we found that TRPM2 modulates autophagy through a c-Jun N-terminal kinase (JNK)-dependent and mechanistic target of rapamycin-independent pathway. We conclude that in the absence of TRPM2, down-regulation of the JNK-signaling pathway impairs autophagy, ultimately causing the accumulation of damaged mitochondria and death of gastric cancer cells. Of note, by inhibiting cell proliferation and promoting apoptosis, the TRPM2 down-regulation enhanced the efficacy of paclitaxel and doxorubicin in gastric cancer cells. Collectively, we provide compelling evidence that TRPM2 inhibition may benefit therapeutic approaches for managing gastric cancer.

Keywords: TRPM2; autophagy; cell proliferation; chemotherapy; gastric cancer; mitochondria; transient receptor potential channels (TRP channels).


Conflict of interest statement

The authors declare that they have no conflicts of interest with the contents of this article

Figures

Figure 1.
Figure 1.
Expression level of TRPM2 is negatively correlated with the overall survival rate of gastric cancer patients. The expression of TRPM2 was analyzed according to the Kaplan-Meier method using a median cutoff. Patients with TRPM2 mRNA levels higher than the median value were considered “high,” and patients with mRNA expression lower than the median were classified as “low.” Survival curves show the correlation between high TRPM2 expression and low patient survival. A, all patients; B, patients with stage I and II cancer and patients with stage III and IV gastric cancer. The hazard ratios generated are greater than 1 suggesting that patients with high TRPM2 expression will die at a higher rate in a given period of time than those with low TRPM2.
Figure 2.
Figure 2.
TRPM2 is functionally expressed in gastric cancer cell lines. A, mRNA expression level of TRPM2 in scrambled control (Scr.) and KD cells normalized to GAPDH, experiment was done in triplicate (n = 3). B, Western blot analysis of TRPM2 protein level, bar graphs show the relative protein level normalized to β-actin (n = 3). C and E, time course of the TRPM2 current measured in the absence (open circles) and presence (white, red, and black) of 2 mm ADPR. D and F, I/V relationship of TRPM2 current (voltage ramp protocol from −80 to 80 mV). Cu2+ (100 μm) was used as TRPM2 current inhibitor (cyan lines). Asterisks indicated a significant difference from scrambler: ***, p < 0.001; **, p < 0.01; *, p < 0.05; mean of data from n = 3.
Figure 3.
Figure 3.
TRPM2 KD inhibits proliferation in AGS and MKN-45 cells. A and C, trypan blue counting of Scr. and TRPM2 knockdown cells at 24, 48, and 72 h after being seeded (n = 4). B and D, MTT assay was used to quantify viable cells at 24, 48, and 72 h after being seeded (n = 5). E and G, CFSE proliferation assay after 4 days of cell culturing. In the corresponding histograms, the x axis represents the CFSE fluorescent signal intensity, and the y axis shows the number of events. F and H, bar graphs representing CFSE mean of data from n = 3; ***, p < 0.001; **, p < 0.01.
Figure 4.
Figure 4.
Down-regulation of TRPM2 promotes cell death in AGS and MKN-45 cells. A, annexin V/7AAD staining of TRPM2 KD and Scr. cells 72 h after being seeded in 6-well plates. Dot plots represent the population of live cells (lower left quadrant), necrotic cells (upper left quadrant), apoptotic cells (lower right quadrant), and early necrotic or late apoptotic cells (upper right quadrant). B, bar graphs depict the quantification of apoptosis data (n = 3). C and D, Western blot analysis of cleaved caspase-7 in TRPM2 KD cells. Statistical significance of Western blotting results was calculated as the relative ratio of cleaved caspase-7 protein normalized to β-actin (n = 3). Asterisks indicated a significant difference from scrambler: ***, p < 0.001; **, p < 0.01; *, p < 0.0; mean of data from n = 3.
Figure 5.
Figure 5.
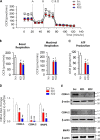
Silencing TRPM2 alters mitochondrial function in gastric cancer cells. Mitochondrial respiration rate of AGS cells was measured using the XF-24 extracellular flux analyzer. A, metabolic flux; B, basal and maximal respiration rates; C, ATP production rates were quantified by the Seahorse Wave 2.3 software. OCR was obtained from both basal condition and following treatment with 1 μm oligomycin (A), 1.5 μm FCCP (B), 1 μm rotenone (C), and 1 μm antimycin A (D) (n = 3). D, mRNA expression level of mitochondrial membrane protein (COX4.1/4.2 and BNIP3) (n = 4). E, Western blot analysis of mitochondrial membrane proteins (n = 3) (t test versus Scr. ***, p < 0.001; **, p < 0.01; *, p < 0.05).
Figure 6.
Figure 6.
Autophagy is inhibited in TRPM2 KD gastric cancer cells. A, autophagy green staining of Scr. and TRPM2 KD cells 72 h after the cells were seeded (data are represented as a histogram and bar graph) (n = 3). B and C, RT-qPCR and Western blot analysis of autophagy markers (n = 4). D, protein level of LC3A/B in Scr. and TRPM2 KD cells after treatment with 80 μm chloroquine (CQ) for 2 h. E, protein level of ATG5 and ATG7 in knockdown cells. F, CFSE proliferation assay in ATG5 KD and ATG7 KD cells 4 days postincubation (results are represented as a histogram and bar graph). G, schematic diagram showing the oxygen consumption and ATP production rate of ATG KD cells as compared with Scr. cells. Experiment was performed in the presence of 1 μm oligomycin (A), 1.5 μm FCCP (B), 1 μm rotenone (C), and 1 μm antimycin A (D). Asterisks indicated a significant difference from scrambler: ***, p < 0.001; **, p < 0.01; *, p < 0.05; mean of data from n = 3.
Figure 7.
Figure 7.
TRPM2 modulates autophagy via a JNK-dependent and mTOR-independent signaling pathway. A and B, Western blot analysis of the protein levels of AKT, p-AKT, mTOR, p-mTOR, 4E-BP1, p-4E-BP1, JNK, and p-JNK in Scr. and TRPM2 KD cells (n = 4). C, protein level of autophagy and mitophagy markers in AGS cells after treatment with 50 μm JNK inhibitor (SP600125) for 24 h (n = 3).
Figure 8.
Figure 8.
TRPM2 down-regulation enhances the efficacy of paclitaxel and doxorubicin in a dose-dependent manner. A–D, MTT cell viability assay in AGS and MKN-45 cells after treatment with various concentrations of paclitaxel or doxorubicin for 24, 48, and 72 h. Data were represented as a dose-response curve with the corresponding IC50 dose of the drugs after 72 h of treatment (IC50 for paclitaxel was 7.4 and 26.2 nm in AGS and MKN-45 cells, respectively; IC50 for doxorubicin was 28 and 44.8 nm in AGS and MKN-45 cells, respectively) (n = 3). E and F, comparison between the viability of Scr. and TRPM2 KD cells 72 h after treatment with the IC50 dose of the two chemotherapeutics. All experiments were performed in triplicate and analyzed for statistical significance using t tests (n = 3, ***, p < 0.001; **, p < 0.01).
Figure 9.
Figure 9.
Knockdown of TRPM2 improves the apoptotic effect of paclitaxel and doxorubicin in gastric cancer cells. A and C, annexin V/7AAD staining of Scr. and TRPM2 KD cells 72 h after treatment with IC50 dose of paclitaxel and/or doxorubicin (n = 3). B and D, bar graph represents quantification of the annexin V/7AAD staining result. The data are represented as a mean of three different experiments. (n = 3, t test versus non-treated cells ***, p < 0.001; **, p < 0.01).

References

    1. Venerito M., Nardone G., Selgrad M., Rokkas T., and Malfertheiner P. (2014) Gastric cancer—epidemiologic and clinical aspects. Helicobacter 19, Suppl. 1, 32–37 - PubMed
    1. González C. A., Sala N., and Rokkas T. (2013) Gastric cancer: epidemiologic aspects. Helicobacter 18, Suppl. 1, 34–38 - PubMed
    1. Kamangar F., Dores G. M., and Anderson W. F. (2006) Patterns of cancer incidence, mortality, and prevalence across five continents: defining priorities to reduce cancer disparities in different geographic regions of the world. J. Clin. Oncol. 24, 2137–2150 10.1200/JCO.2005.05.2308 - DOI - PubMed
    1. Fock K. (2014) The epidemiology and prevention of gastric cancer. Aliment. Pharmacol. Ther. 40, 250–260 10.1111/apt.12814 - DOI - PubMed
    1. Brenner H., Rothenbacher D., and Arndt V. (2009) Epidemiology of stomach cancer. Methods Mol. Biol. 472, 467–477 10.1007/978-1-60327-492-0_23 - DOI - PubMed

Publication types

MeSH terms