. 2018 Jan 30;115(5):E982-E991.
doi: 10.1073/pnas.1718600115. Epub 2018 Jan 17.

PAR1 agonists stimulate APC-like endothelial cytoprotection and confer resistance to thromboinflammatory injury

Affiliations

PAR1 agonists stimulate APC-like endothelial cytoprotection and confer resistance to thromboinflammatory injury

Karen De Ceunynck et al. Proc Natl Acad Sci U S A. .

Abstract

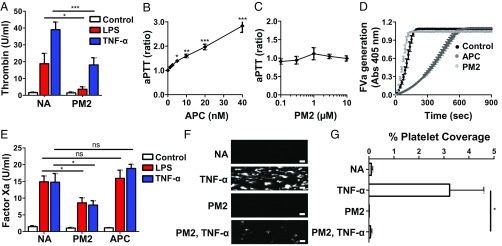
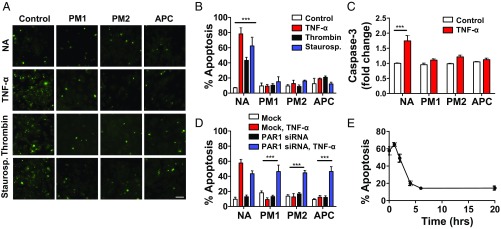
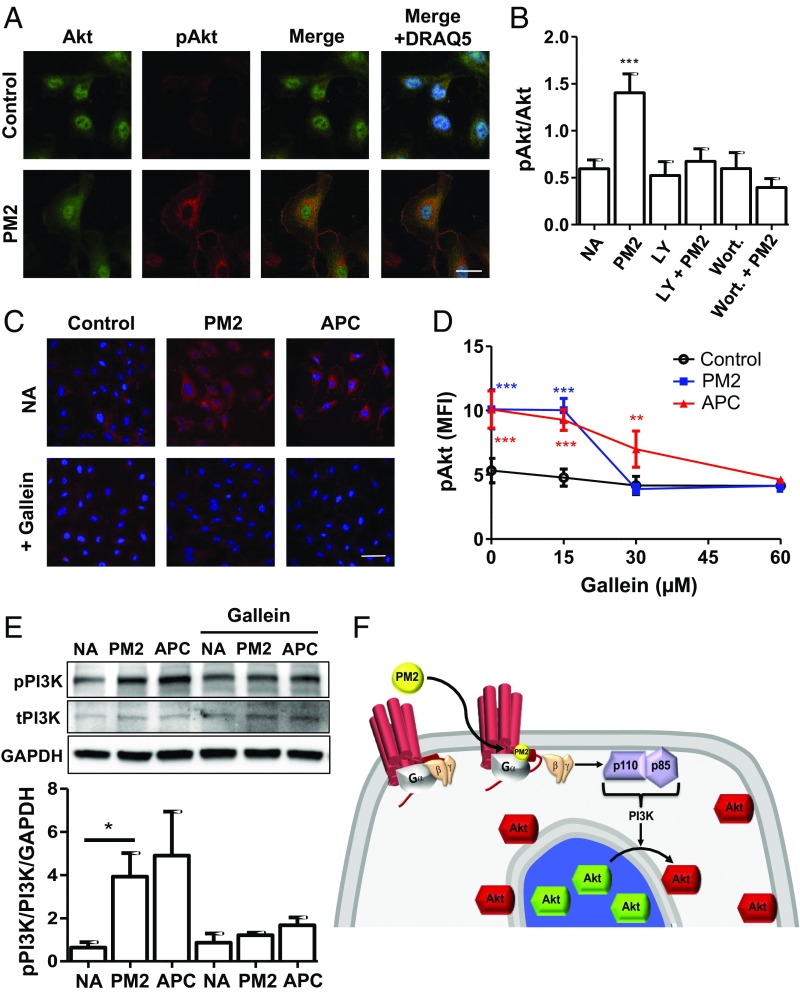
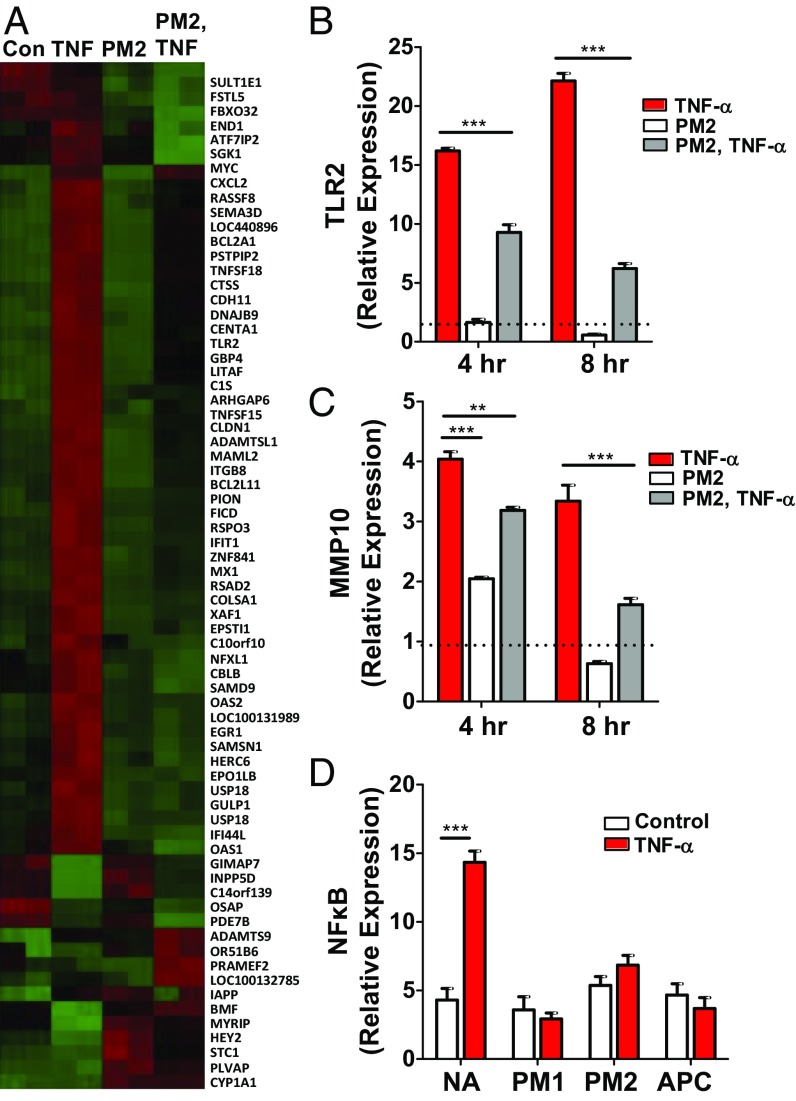
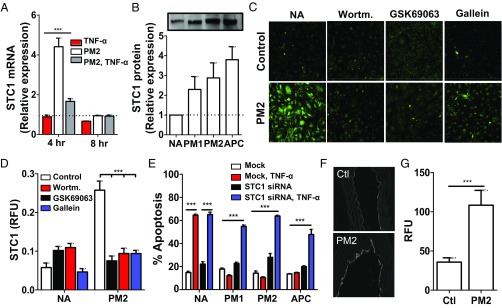
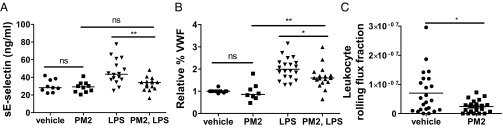
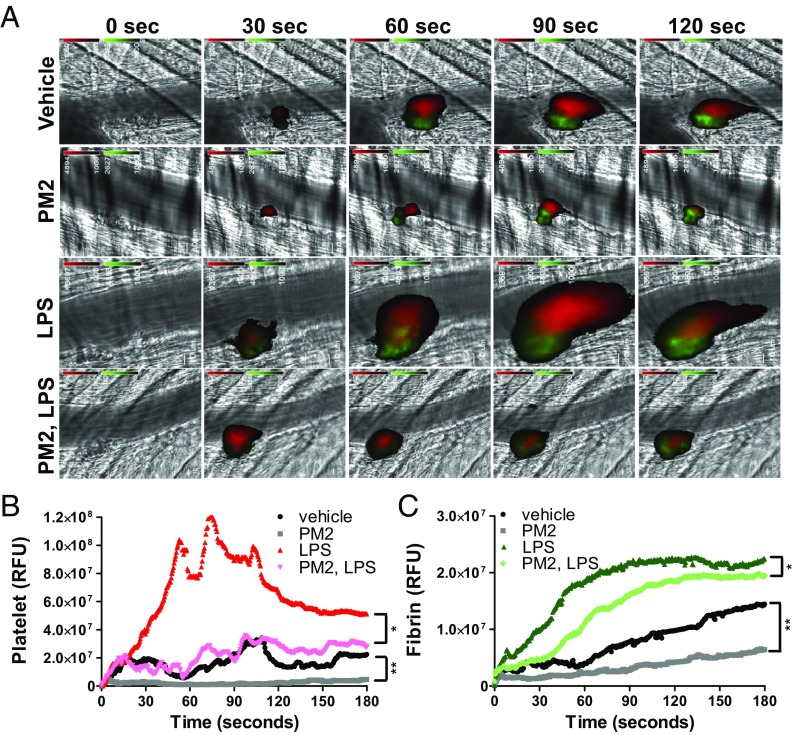
Stimulation of protease-activated receptor 1 (PAR1) on endothelium by activated protein C (APC) is protective in several animal models of disease, and APC has been used clinically in severe sepsis and wound healing. Clinical use of APC, however, is limited by its immunogenicity and its anticoagulant activity. We show that a class of small molecules termed "parmodulins" that act at the cytosolic face of PAR1 stimulates APC-like cytoprotective signaling in endothelium. Parmodulins block thrombin generation in response to inflammatory mediators and inhibit platelet accumulation on endothelium cultured under flow. Evaluation of the antithrombotic mechanism showed that parmodulins induce cytoprotective signaling through Gβγ, activating a PI3K/Akt pathway and eliciting a genetic program that includes suppression of NF-κB-mediated transcriptional activation and up-regulation of select cytoprotective transcripts. STC1 is among the up-regulated transcripts, and knockdown of stanniocalin-1 blocks the protective effects of both parmodulins and APC. Induction of this signaling pathway in vivo protects against thromboinflammatory injury in blood vessels. Small-molecule activation of endothelial cytoprotection through PAR1 represents an approach for treatment of thromboinflammatory disease and provides proof-of-principle for the strategy of targeting the cytoplasmic surface of GPCRs to achieve pathway selective signaling.

Keywords: PAR1; cytoprotection; endothelium; inflammation; thrombosis.


Conflict of interest statement

Conflict of interest statement: R.F. and C.D. are inventors on a patent describing parmodulins.

Figures

Fig. 1.
Fig. 1.
A biased PAR1 agonist is thromboprotective at the level of endothelium. (A) Effect of PM2 on LPS- and TNF-α–induced thrombin generation. HUVECs were preincubated with vehicle (NA) or PM2 (3 µM) for 4 h. Samples were either left untreated (control) or then exposed to TNF-α (10 ng/mL) or LPS (100 ng/mL) for an additional 4 and 3 h, respectively. Thrombin generation was monitored using a fluorogenic thrombin substrate. Values are normalized to controls and depicted as mean ± SEM (n ≥ 6). One-way ANOVA with Bonferroni posttests was used to compare groups. *P < 0.05; ***P < 0.001. (B and C) Comparison of the dose dependency of (B) APC and (C) PM2 in an aPTT assay. Clotting times are represented as the ratio of samples containing APC or PM2 versus control samples. Data represent mean ± SEM of seven samples normalized to control samples. A matched one-way ANOVA with Bonferroni posttests was used to compare PM2- and APC-treated groups to control. *P < 0.05; **P < 0.01, ***P < 0.001. (D) Effect of PM2 and APC on FVa generation. HUVECs were incubated with PM2 (10 µM) for 4 h and APC (10 nM) for 15 min. FVa generation was measured using a chromogenic substrate and depicted as a function of time. Representative experiment of three independent experiments. (E) HUVECs were preincubated with vehicle (NA), PM2 (3 µM), or APC (10 nM) for 4 h. Samples were either left untreated (control) or then exposed to TNF-α (10 ng/mL) or LPS (100 ng/mL) for an additional 4 and 3 h, respectively. Factor Xa generation was monitored using a chromogenic FXa substrate. Values are normalized to controls and depicted as mean ± SEM (n ≥ 6). One-way ANOVA with Bonferroni posttests was used to compare groups. *P < 0.05. (F and G) Bioengineered microvessels were perfused with either vehicle [No addition (NA), TNF-α] or parmodulin 2 (PM2; PM2, TNF-α) for 4 h. Samples were subsequently washed and perfused with whole blood containing either buffer alone (NA, PM2) or TNF-α (TNF-α; PM2, TNF-α). Platelet accumulation on endothelial monolayers was detected using an anti-CD41-PE antibody and visualized by videomicroscopy. (Scale bar: 100 μm.) (F) A composite image made from separate micrographs of an endothelial cell surface is shown. Separate fields have been spliced together to create the image. (G) Quantification of TNF-α–induced platelet accumulation on endothelium. Data represent mean ± SEM (n = 3–5). The t-tests were used for statistical analysis to compare TNF-α and PM2, TNF-α groups. *P < 0.05. ns, nonsignificant.
Fig. 2.
Fig. 2.
A biased PAR1 agonist is cytoprotective in endothelial cells. (A and B) HUVECs were exposed to vehicle, PM1 (10 µM), PM2 (3 µM), or APC (10 µg/mL) for 4 h before exposure to buffer alone (NA), TNF-α (10 ng/mL), thrombin (1 U/mL), or staurosporine (10 µM) for an additional 4 h. Samples were evaluated for apoptosis by YO-PRO-1 staining (green) using fluorescence microscopy. (A) Representative images of YO-PRO-1 staining. (Scale bar: 25 μm.) (B) Quantification of the percentage of apoptotic cells. Data represent mean ± SEM (n = 4–5). Two-way ANOVA with Bonferroni’s multiple comparison tests was used to compare groups. ***P < 0.001. (C) HUVECs were exposed to vehicle, PM1 (10 µM), PM2 (10 µM), or APC (5 µg/mL) for 4 h before exposure to buffer alone (NA) or TNF-α (50 ng/mL). Samples were evaluated for apoptosis using an antibody that detects cleaved caspase-3 as described in Materials and Methods. Fold change in relative fluorescence unit is depicted versus control-treated cells. Data represent the mean ± SEM (n = 6). Two-way ANOVA with Bonferroni posttests was used to compare groups. ***P < 0.001. (D) HUVECs were transfected with F2R-targeted siRNA (black, blue) or mock-transfected (white, red). Following confirmation of knockdown, samples were exposed to vehicle (NA), PM1 (10 µM), PM2 (3 µM), or APC (10 µg/mL) for 4 h before exposure to buffer or TNF-α (10 ng/mL) for an additional 4 h. Percentage of apoptotic cells was determined by fluorescence microscopy. Data represent the mean ± SEM (n = 4–5). Two-way ANOVA with Bonferroni posttests was used to compare groups. ***P < 0.001. (E) Time course of parmodulin-2–mediated protection from staurosporine-induced apoptosis. HUVECs were preincubated with PM2 (3 µM) for various times followed by exposure to staurosporine (10 µM) for an additional 4 h. The percentage of apoptotic cells was determined by fluorescence microscopy. Data represent the mean ± SEM (n = 6–7).
Fig. 3.
Fig. 3.
Parmodulins stimulate an APC-like signaling pathway. (A) HUVECs were exposed to either vehicle or 3 μM PM2 and stained using an anti-Akt antibody (green), a phospho-Akt antibody (red), and DRAQ5 (blue) to visualize nuclei. Samples were then evaluated using three-color confocal immunofluorescence microscopy. (Scale bar: 25 μm.) (B) HUVECs were incubated with vehicle (NA), 0.1 μM wortmannin (Wort), or 50 μM LY294002 (LY) and subsequently exposed to either vehicle or PM2 as indicated. Samples were analyzed for phospho-Akt using confocal immunofluorescence microscopy, and staining intensity was quantified using Image J. Data represent mean ± SEM (n = 5). One-way ANOVA with Bonferroni posttest was used to compare groups. ***P < 0.001. (CE) HUVECs were incubated in the presence or absence of gallein for 30 min. Samples were subsequently exposed to control, PM2, or APC for 4 h. (C) Cells were stained using a phospho-PI3K antibody and evaluated using confocal immunofluorescence microscopy. (Scale bar: 50 μm.) (D) Quantification of the inhibition by gallein of Akt phosphorylation induced using either PM2 (blue) or APC (red) compared with control (black). Data represent mean fluorescent intensities ± SEM (n = 3). One-way ANOVA with Bonferroni posttests was used to compare PM2- and APC-treated groups to control. **P < 0.01; ***P < 0.001. (E) Immunoblot analysis demonstrating the inhibition of PM2- and APC-induced PI3K phosphorylation by gallein (60 µM). Data represent mean ± SEM (n = 4). One-way ANOVA with Bonferroni posttests was used to compare groups to NA: *P < 0.05. (F) Model illustrating the proposed role of Gβγ in PM2 signaling. PM2 associates with the cytoplasmic face of PAR1 displacing Gβγ and enabling it to activate PI3K. PI3K then phosphorylates Akt that is localized to perinuclear and plasma membranes.
Fig. 4.
Fig. 4.
Gene expression profiling of endothelial cells following exposure to parmodulin 2. (A) Transcript profiling of HUVECs was performed using GeneChip Human Gene 1.0 ST Affymetrix chip following incubation of endothelium with vehicle alone (NA), 10 ng/mL TNF-α (TNF), 3 μM PM2 (PM2), or PM2 followed by TNF-α (PM2, TNF). (B and C) HUVECs were exposed to vehicle (red) or PM2 (white, gray) for 4 h before exposure to buffer (white) or TNF-α (red, gray) for an additional 4 h. Samples were subsequently evaluated for either (B) TLR2 mRNA or (C) MMP10 mRNA using qRT-PCR. Dashed line represents the value of samples exposed to vehicle alone. Data represent fold difference of triplicate samples (mean ± SEM) compared with the control (NA) at 4 h. (D) Transcriptional activation downstream from NF-κB was detected using a GFP-based reporter system. HUVECs were exposed to vehicle (NA), 10 µM PM1, 3 μM PM2, or 5 µg/mL APC for 4 h before exposure to TNF-α for an additional 4 h. NF-κB expression was analyzed using immunofluorescence microscopy. Data represent mean ± SEM (n = 4–5). (BD) Two-way ANOVA with Bonferroni’s multiple comparison tests was used. **P < 0.01; ***P < 0.001.
Fig. 5.
Fig. 5.
Stanniocalcin-1 is up-regulated by parmodulin exposure and is essential for cytoprotection. (A) HUVECs were exposed to vehicle or 3 μM PM2 for 4 h before exposure to buffer or 10 ng/mL TNF-α. Subsequently, samples were evaluated for STC1 mRNA expression using qRT-PCR. Dashed line represents value of samples exposed to vehicle alone. Data represent fold difference of triplicate samples (mean ± SEM) compared with the no addition control. Two-way ANOVA with Bonferroni’s multiple comparison tests was used. ***P < 0.001. (B) Quantification of immunoblot analysis for stanniocalcin-1 (STC1) protein. Data represent fold difference (mean ± SEM) compared with no addition (NA) control at 4 h (n = 4). Inset shows a representative immunoblot of HUVEC lysates following exposure to vehicle, PM1, PM2, or APC. (C and D) HUVECs were preincubated with wortmannin (Wortm.; 0.1 µM), Akt inhibitor GSK69063 (0.2 µM), or gallein (60 µM) for 30 min before incubation with vehicle or PM2 (10 µM) in the absence or presence of inhibitors for an additional 4 h. Following incubation, HUVECs were stained with anti-STC1 antibody (green) and DAPI (blue) and evaluated by immunofluorescence microscopy. (C) Representative images. (Magnification: 60×.) (D) Quantification of STC1 expression as calculated by the ratio of relative fluorescence units (RFUs) versus number of cells. Data represent mean ± SEM (n = 6). Two-way ANOVA with Bonferroni’s multiple comparison tests was used. ***P < 0.001. (E) HUVECs were transfected with siRNA targeted at STC1 (black, blue) or mock-transfected (white, red). Following knockdown, samples were exposed to vehicle, PM1, PM2, or APC for 4 h before exposure to buffer (white, black) or 10 ng/mL TNF-α (red, blue) for an additional 4 h. The percentage of apoptotic cells was determined using fluorescence microscopy. Data indicate the mean ± SEM (n = 4–5). Two-way ANOVA with Bonferroni posttests was used. ***P < 0.001. (F) Representative image of confocal immunofluorescence microscopy of aorta from mice infused with vehicle (Control, or Ctl) or 10 mg/kg PM2 and stained using anti-STC1 antibody. (Magnification: 5×.) (G) Immunofluorescence quantitation of STC1 staining in aortas of mice infused with vehicle (n = 181 fields) or 10 mg/kg parmodulin 2 (n = 222 fields). Unpaired t test was used to compare PM2 to control (Ctl). ***P < 0.001.
Fig. 6.
Fig. 6.
Parmodulins interfere with activation of endothelium in vivo. Mice were infused with either vehicle or PM2 (10 mg/kg) 3 h before LPS exposure and an additional bolus injection of vehicle or PM2 just before saline or 10 mg/kg LPS injection. After a 3-h incubation period, plasma was obtained from mice and evaluated for either (A) soluble E-selectin (sE-selectin) or (B) VWF using ELISA. Data represent mean ± SEM of number of mice treated with vehicle (n = 9), PM2 (n = 9), LPS (n = 15), and PM2, LPS (n = 16). Statistical significance was determined using a Mann–Whitney test with a Hochberg’s step-up method. *P < 0.05; **P < 0.01. (C) Mice were infused with either vehicle or 10 mg/kg PM2, and surgery-induced leukocyte rolling was monitored by intravital microscopy. Rolling flux was calculated as described in Materials and Methods. Data represent mean ± SEM of 22 (vehicle) and 23 (PM2) measurements. Mann–Whitney test was used to determine significance. *P < 0.05. ns, nonsignificant.
Fig. 7.
Fig. 7.
Parmodulins are protective in the setting of thromboinflammation. (A) Mice were injected i.v. with vehicle or PM2 (5–10 mg/kg) 2.5 h before 10 mg/kg LPS administration i.p. and with an additional bolus 0.5 h after LPS exposure. Thrombus formation was induced by endothelial laser injury in cremaster arterioles 1–3 h following LPS injection. Platelet (red) and fibrin (green) accumulation were monitored for 180 s using Dylight 647-labeled antiplatelet antibody (CD42b) and Dylight 488-labeled antifibrin antibody (59D8). Representative binarized images from a single thrombus are shown for vehicle, PM2, and LPS and PM2 followed by LPS. (B and C) Median integrated platelet and fibrin fluorescent intensities following laser injury were calculated for all thrombi in vehicle (n = 37), PM2 (n = 37), LPS (n = 30), and PM2 followed by LPS (n = 38) experiments. (Magnification: 60×.) (B) Median integrated platelet fluorescent intensities are indicated for vehicle (black), PM2 (gray), LPS alone (red), PM2 followed by LPS (pink). (C) Median integrated platelet fluorescent intensities are indicated for vehicle (black), PM2 (gray), LPS alone (dark green), and PM2 followed by LPS (light green). A Kruskal–Wallis test with multiple comparisons was used. *P < 0.05. **P < 0.01.

Similar articles

Cited by

References

    1. Vu TK, Hung DT, Wheaton VI, Coughlin SR. Molecular cloning of a functional thrombin receptor reveals a novel proteolytic mechanism of receptor activation. Cell. 1991;64:1057–1068. - PubMed
    1. Griffin CT, Srinivasan Y, Zheng YW, Huang W, Coughlin SR. A role for thrombin receptor signaling in endothelial cells during embryonic development. Science. 2001;293:1666–1670. - PubMed
    1. Trivedi V, et al. Platelet matrix metalloprotease-1 mediates thrombogenesis by activating PAR1 at a cryptic ligand site. Cell. 2009;137:332–343. - PMC - PubMed
    1. Sen P, et al. Factor VIIa bound to endothelial cell protein C receptor activates protease activated receptor-1 and mediates cell signaling and barrier protection. Blood. 2013;117:3199–3208. - PMC - PubMed
    1. Tressel SL, et al. A matrix metalloprotease-PAR1 system regulates vascular integrity, systemic inflammation and death in sepsis. EMBO Mol Med. 2011;3:370–384. - PMC - PubMed

Publication types

MeSH terms