. 2018 Jan 17;8(1):900.
doi: 10.1038/s41598-018-19259-4.

A novel microRNA, hsa-miR-6852 differentially regulated by Interleukin-27 induces necrosis in cervical cancer cells by downregulating the FoxM1 expression

Affiliations

A novel microRNA, hsa-miR-6852 differentially regulated by Interleukin-27 induces necrosis in cervical cancer cells by downregulating the FoxM1 expression

Deepak Poudyal et al. Sci Rep. .

Abstract

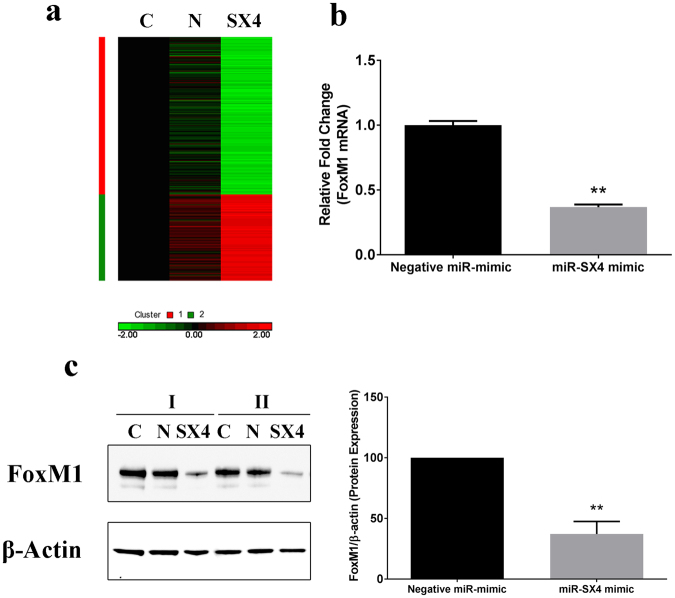
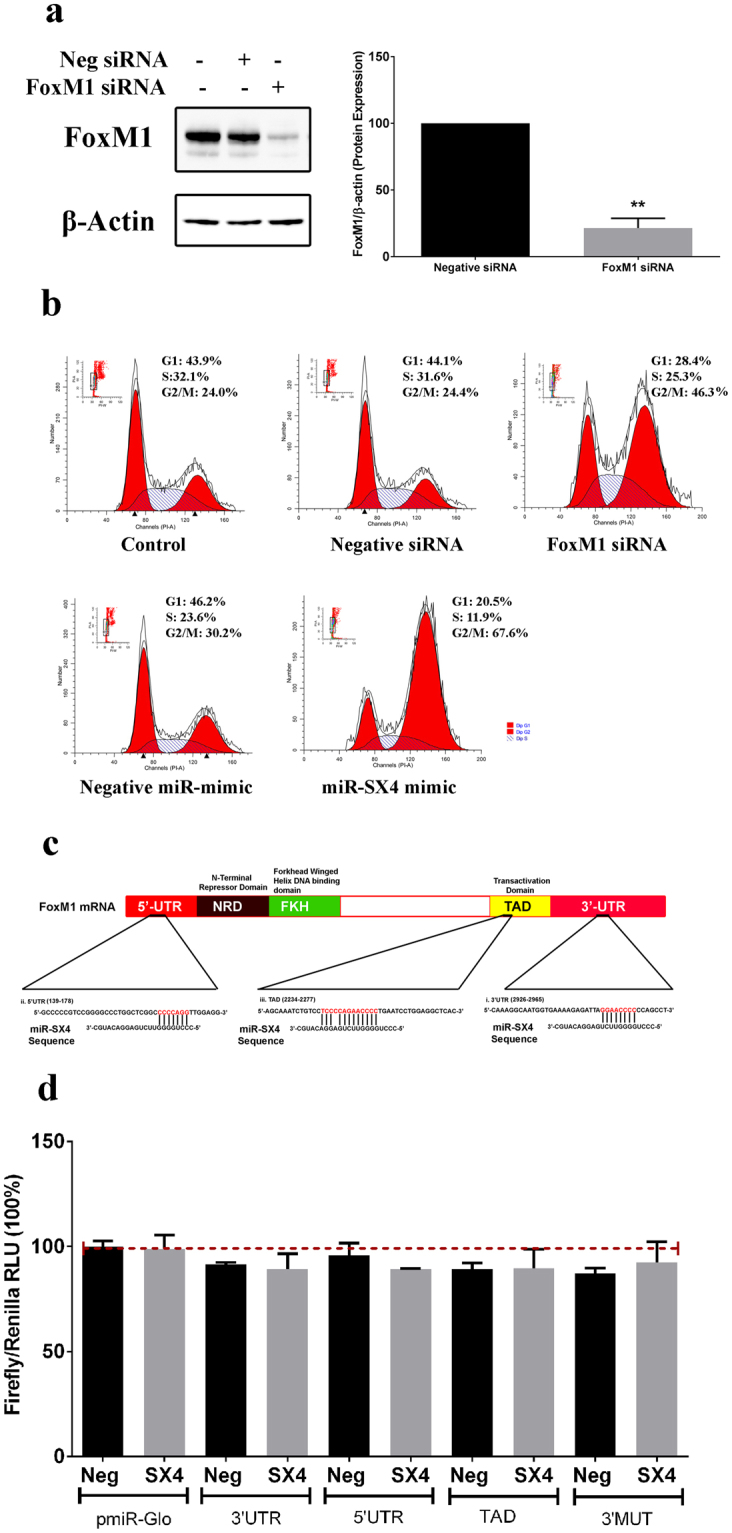
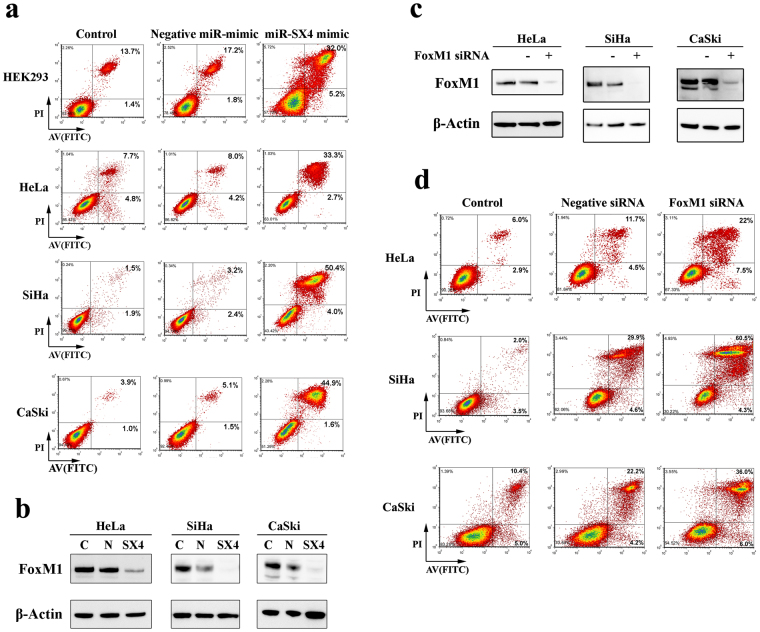
We have previously demonstrated that Interleukin-27 differentially regulates the expression of seven novel microRNAs. Here we elucidate the functional significance of these novel microRNAs. Of the seven microRNAs, over expression of miRNA-6852 (miR-SX4) mimic induces cell cycle arrest at G2/M phase and induces necrosis in HEK293 and panel of cervical cancer cells (Human Papilloma Virus (HPV) infected cell lines; HeLa, CaSki and SiHa cells). To define the mechanism of the miR-SX4-mediated G2/M arrest, a microarray gene chip array and western blot analysis were performed. FoxM1, a transcription factor is identified as a key protein down-regulated by miR-SX4, even though the miR-SX4 does not target 3'UTR of FoxM1. Knock down of FoxM1 using si-RNA demonstrate that FoxM1 silenced cell induces G2/M cell cycle arrest and necrosis. Our data demonstrated for the first time that miR-SX4 could be a potent anti-cancer microRNA.


Conflict of interest statement

The authors declare that they have no competing interests.

Figures

Figure 1
Figure 1
miR-SX4 induces cell cycle arrest in HEK293 cells and panel of cervical cancer cell lines. (a) Cell cycle phases were analyzed based on the DNA content from the histogram plot in the HEK293 cells transfected with 10 nM miRNA mimics and BD FACSDiva software was used to analyze G1,(2n) S(4n) and G2 (2n + 2n) phase of the cells, 48 h post transfection. Negative miRNA mimic was used as a negative control. X-axis indicates the PI staining (representative of DNA content) and Y-axis indicates the cell number. A minimum of 20,000 events was counted by Flow cytometry for each treatment. Representative figure is from 3 separate experiments. (b) Representative bar graph was plotted to show G2/M phase arrest in miR-SX4 mimic transfected HEK293 cells. (n = 3, Mean ± S.E.M; **p < 0.01). (c) HeLa, CaSki and SiHa cells were transfected with 20 nM of either negative miRNA mimic or miRNA-SX4 mimic and harvested 48 h post transfection for cell cycle analysis. Representative figure is from 3 separate experiments. (d) Representative bar graph was plotted to show G2/M phase arrest in miR-SX4 mimic transfected HeLa, CaSki and SiHa cells. (n = 3, Mean ± S.E.M; *p < 0.05, **p < 0.01).
Figure 2
Figure 2
Mimic miR-SX4 downregulates FoxM1 expression (a) Genechip Heat Map to compare the gene expression levels in miR-SX4 mimic transfected HEK293 cells. Gene expression levels are depicted as color variation from red (high expression) to green (low expression) with fold change greater than 2 when compared with negative miR mimic control. The color in each cell of the figure displays the level of expression for each gene. C, N and SX4 represents the untransfected control, Negative miRNA mimic and mimic miR-SX4 transfected cell respectively. C, N and SX4 heat map are representative mean figure of 3 separate experiments. (b) FoxM1 gene expression level of miR-SX4 mimic transfected cells was quantified by RT-PCR using a gene specific probe. Data shown represents means ± SE of 3 independent studies (**p < 0.01). (c) The whole cell lysates of miR-SX4 transfected cells was used to determine the protein expression levels of FoxM1 and internal control β-actin by western blot analysis. The same western blot membrane was stripped and probed with β-actin antibody as a control. The protein expression of FoxM1 was quantified and normalized with β-actin expression level using NIH Image J analysis software. Data represents (average ± S.D; **p < 0.01) the normalized FoxM1 levels of miRNA-SX4 transfected cells compared to negative miRNA mimic transfected cells.
Figure 3
Figure 3
si-RNA of FoxM1 induces G2/M cell cycle arrest and miR-SX4 indirectly targets FoxM1. (a) 20 nM siRNA against FoxM1 and negative siRNA transfected HEK293 cells (48 h, 37 °C) were harvested and western blot analysis was performed to confirm the down-regulation of FoxM1 protein level. The same western blot membrane was stripped and probed with β-actin antibody as a control. NIH Image J was used to analyze the percentage of FoxM1/β-actin protein level down-regulated in FoxM1 siRNA transfected cells when compared to negative siRNA transfected cells. (b) The same set of cells transfected with si-RNA against FoxM1 and negative siRNA were harvested for cell cycle analysis. The percentage of cells in G2/M phase are displayed below the histogram plot of cell population (Y-axis) Vs PI stain (X-axis). miR-SX4 mimic, 10 nM, 48 h was used as a positive control. (c) Nucleotide blast was performed using NCBI nucleotide blastn program to identify the complementary sequences (>7nts) between the FoxM1 mRNA and mature miR-SX4. Three regions were identified in 5′UTR, 3′UTR and TAD region. The complementary sequence of 3′UTR region was modified and called 3′UTR MUT. These regions with complementary sequences are depicted in this figure. The oligonucleotides (60 nts length) from the identified regions were synthesized and cloned into pmiR-Glo vector. (d) For target validation of miR-SX4 and the regions of nucleotides in mRNA of FoxM1, the plasmid pmiR-Glo with inserted potential target sequences were cotransfected for 48 h (plasmid pmiR-Glo, 100ng and miR-SX4 (50 nM) or negative miR-mimic (50 nM)) in HEK293T cells and firefly luciferase and renilla luciferase reading was obtained. The figure represents the mean ± S.D of the Firefly/Renilla luciferase reading.
Figure 4
Figure 4
miR-SX4 reduces the expression of FoxM1 target proteins. (a) HEK293 cells untransfected (C), Negative miRNA mimic (N) and miRNA-6852 mimic (SX4) transfected cells were harvested and protein expression levels were determined by western blot for FoxM1, regulators of FoxM1 (FoxO3a and p-FoxO3a, B-Myb and Myc) and transcriptional targets of FoxM1 (Plk1, AuroraK B, Survivin, Cdc25B, Cdc 25 C, Cdk1, Cyclin A2 and Cyclin B1). β-actin protein expression was determined for internal control. Figure 4a: i, ii, and iii images are separate western blot gel/membranes which has been stripped and reprobed with antibodies as mentioned. (b) HEK293 cells: C, N and SX4 transfected cells were harvested and protein expression levels were determined by western blot for upstream regulator of FoxM1, AKT/pAKT, p-p38 MAPK, ERK/p-ERK1/2, AMPKα/p-AMPKα. β-actin protein expression was determined for internal control. Figure 4b, i and iii are same western blot gel/membranes stripped and probed with another antibody; Fig. 4b, ii is another western blot gel/membrane stripped and reprobed with antibodies as mentioned. The number below the protein band represents the densitometry analysis (NIH Image J software) of protein bands normalized to β-actin or total protein levels. Bands observed for SX4 is compared with Negative miRNA mimic control (N).
Figure 5
Figure 5
miRNA-SX4 and siRNA-FoxM1 induces necrosis in Cervical Cancer Cell lines. (a) Apoptosis/Necrosis analysis of HEK293 cells and cervical cancer cell lines (HeLa, SiHa and CaSki cells), 72 h post transfection of miR-SX4 mimic (20 nM), negative miR mimic was used as a negative control. Top right quadrant AV + /PI + population indicative of late apoptosis or necrotic cells are monitored. (b) Western blot analysis of FoxM1 protein expression in miR-SX4 transfected HeLa, CaSki and SiHa cells. Each membrane was stripped and probed with β-actin control antibody as mentioned. (c) Western blot analysis was performed in the same set of HeLa, CaSki and SiHa cells transfected with siRNA against FoxM1 and non-targeting negative control to determine the downregulation of FoxM1 protein level. Each membrane was stripped and probed with β-actin control antibody as mentioned. (d) siRNA (20 nM) against non-specific target (negative siRNA) and FoxM1 transfected HeLa, CaSKi and SiHa cells (72 h), were harvested for AV/PI stain. Apoptosis/Necrosis was analyzed using a flow cytometry and representative dot plot is shown.

References

    1. Tomari Y, Matranga C, Haley B, Martinez N, Zamore PD. A protein sensor for siRNA asymmetry. Science. 2004;306:1377–1380. doi: 10.1126/science.1102755. - DOI - PubMed
    1. Brodersen P, Voinnet O. Revisiting the principles of microRNA target recognition and mode of action. Nature reviews. Molecular cell biology. 2009;10:141–148. doi: 10.1038/nrm2619. - DOI - PubMed
    1. Lee RC, Feinbaum RL, Ambros V. The C. elegans heterochronic gene lin-4 encodes small RNAs with antisense complementarity to lin-14. Cell. 1993;75:843–854. doi: 10.1016/0092-8674(93)90529-Y. - DOI - PubMed
    1. Hanahan D, Weinberg RA. Hallmarks of cancer: the next generation. Cell. 2011;144:646–674. doi: 10.1016/j.cell.2011.02.013. - DOI - PubMed
    1. Li M, et al. MicroRNAs: control and loss of control in human physiology and disease. World journal of surgery. 2009;33:667–684. doi: 10.1007/s00268-008-9836-x. - DOI - PMC - PubMed

Publication types