. 2018 Jan 17;8(1):976.
doi: 10.1038/s41598-018-19287-0.

Magnetoencephalographic Correlates of Perceptual State During Auditory Bistability

Affiliations

Magnetoencephalographic Correlates of Perceptual State During Auditory Bistability

Robert D Sanders et al. Sci Rep. .

Abstract

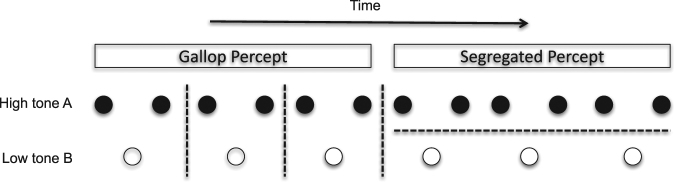
Bistability occurs when two alternative percepts can be derived from the same physical stimulus. To identify the neural correlates of specific subjective experiences we used a bistable auditory stimulus and determined whether the two perceptual states could be distinguished electrophysiologically. Fourteen participants underwent magnetoencephalography while reporting their perceptual experience while listening to a continuous bistable stream of auditory tones. Participants reported bistability with a similar overall proportion of the two alternative percepts (52% vs 48%). At the individual level, sensor space electrophysiological discrimination between the percepts was possible in 9/14 participants with canonical variate analysis (CVA) or linear support vector machine (SVM) analysis over space and time dimensions. Classification was possible in 14/14 subjects with non-linear SVM. Similar effects were noted in an unconstrained source space CVA analysis (classifying 10/14 participants), linear SVM (classifying 9/14 subjects) and non-linear SVM (classifiying 13/14 participants). Source space analysis restricted to a priori ROIs showed discrimination was possible in the right and left auditory cortex with each classification approach but in the right intraparietal sulcus this was only apparent with non-linear SVM and only in a minority of particpants. Magnetoencephalography can be used to objectively classify auditory experiences from individual subjects.


Conflict of interest statement

The authors declare that they have no competing interests.

Figures

Figure 1
Figure 1
Schematic representing the two possible percepts from the bistable auditory stimulus of a triplet of tones. The tone length was 100 ms and within the triplet the inter-tone time was 50ms. Between each triplet of A-B-A there was a 200 ms gap.
Figure 2
Figure 2
Individual level distributions for the frequency of percept (y-axis) versus log duration of percept (x-axis). Percept durations are presented logged to account for significant inter-subject variability, normalising the data. Duration histograms are shown for both percepts on the same plot. Perceived gallop rhythm identified by red bars and segregated by blue. Significant within-subject effects are shown by colouring the background for the longer duration percept (red for gallop, blue for segregated). n# refers to the number of perceptual switches and μ refers to the mean (standard deviation).
Figure 3
Figure 3
Heat map showing number of participants for whom significant differences found when data analysis was restricted to the source showing maximum posterior variance within each of 34 anatomical ROIs. The most successful region for determining differences in perceptual state was the right superior temporal cortex. Scale bar shows the number of subjects showing significant effects with analysis restricted to that ROI.
Figure 4
Figure 4
Time courses of first principal component of activity across right temporal sensors for segregated and gallop percepts (A). Time 0 represents onset of A tone at the start of the triplet. Grey region indicates the time window of statistical significance (250–273 ms; cluster level corrected in SPM at p < 0.05 FWE with uncorrected threshold of p < 0.005) (B) Activity difference-time plot showing the mean group difference in evoked response in black with + /−1 SEM in dark grey, + /−2 SEM in light grey. Individual difference plots are shown in red.

References

    1. Gutschalk A, Dykstra AR. Functional imaging of auditory scene analysis. Hearing research. 2014;307:98–110. doi: 10.1016/j.heares.2013.08.003. - DOI - PubMed
    1. Frith C, Perry R, Lumer E. The neural correlates of conscious experience: an experimental framework. Trends Cogn Sci. 1999;3:105–114. doi: 10.1016/S1364-6613(99)01281-4. - DOI - PubMed
    1. Blake RR, Fox R, McIntyre C. Stochastic properties of stabilized-image binocular rivalry alternations. Journal of experimental psychology. 1971;88:327–332. doi: 10.1037/h0030877. - DOI - PubMed
    1. Haynes JD, Deichmann R, Rees G. Eye-specific effects of binocular rivalry in the human lateral geniculate nucleus. Nature. 2005;438:496–499. doi: 10.1038/nature04169. - DOI - PMC - PubMed
    1. Sandberg K, et al. Early visual responses predict conscious face perception within and between subjects during binocular rivalry. J Cogn Neurosci. 2013;25:969–985. doi: 10.1162/jocn_a_00353. - DOI - PMC - PubMed

Publication types

LinkOut - more resources