. 2018 Jan 17;8(1):888.
doi: 10.1038/s41598-018-19441-8.

A Survey of Validation Strategies for CRISPR-Cas9 Editing

Affiliations

A Survey of Validation Strategies for CRISPR-Cas9 Editing

Monica F Sentmanat et al. Sci Rep. .

Abstract

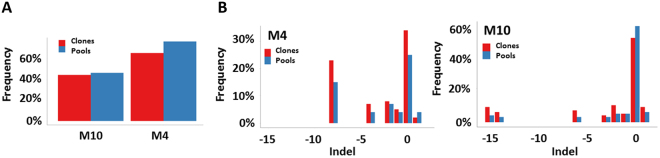
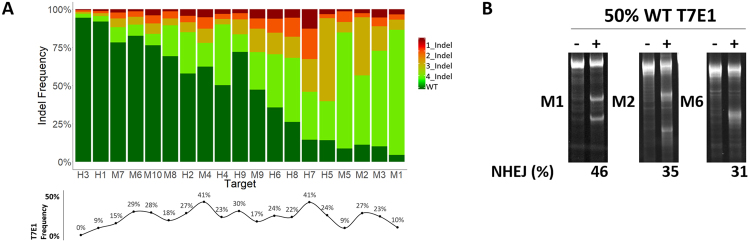
The T7 endonuclease 1 (T7E1) mismatch detection assay is a widely used method for evaluating the activity of site-specific nucleases, such as the clustered regularly interspaced short palindromic repeats (CRISPR)-Cas9 system. To determine the accuracy and sensitivity of this assay, we compared the editing estimates derived by the T7E1 assay with that of targeted next-generation sequencing (NGS) in pools of edited mammalian cells. Here, we report that estimates of nuclease activity determined by T7E1 most often do not accurately reflect the activity observed in edited cells. Editing efficiencies of CRISPR-Cas9 complexes with similar activity by T7E1 can prove dramatically different by NGS. Additionally, we compared editing efficiencies predicted by the Tracking of Indels by Decomposition (TIDE) assay and the Indel Detection by Amplicon Analysis (IDAA) assay to that observed by targeted NGS for both cellular pools and single-cell derived clones. We show that targeted NGS, TIDE, and IDAA assays predict similar editing efficiencies for pools of cells but that TIDE and IDAA can miscall alleles in edited clones.


Conflict of interest statement

The authors declare that they have no competing interests.

Figures

Figure 1
Figure 1
CRISRP-Cas9 activity reported with the T7E1 Assay and Next-Generation Sequencing. (A) NHEJ frequency with the T7E1 assay. Representative gel images of T7E1-treated PCR products amplified from the target sites of GFP-negative controls (−) and edited pools (+). (B) NHEJ events in CRISPR-Cas9 targets reported by NGS (black bars) or the T7E1 assay (grey bars). Data represent the mean of three biological replicates ±SEM. (C) Indel size spectrum (x-axis) and frequency (y-axis) identified by targeted NGS. The top four most prevalent reads are shown below the sgRNA sequence (5′ to 3′) with corresponding deletions (black dashes) and insertions (red letters). Red arrows identify sgRNA cut sites. Data represent the mean of three biological replicates ±SEM.
Figure 2
Figure 2
Targeted deep-sequencing of edited pools and single cell derived clones. (A) Overall indel frequency measured by targeted deep sequencing for M10 and M4 edited cell pools (blue) and clones (red). (B) Comparison of indel sizes and frequencies between M4 and M10 cell pools (blue) and individual clones (red). Indel frequencies for M4 and M10 clones were averaged across 136 and 105 individual clones, respectively.
Figure 3
Figure 3
Improved T7E1 sensitivity with amplicon diversity. (A) Histogram of the top 4 indels and WT sequence across all targets ordered from lowest to highest in activity reported by targeted deep sequencing. A line diagram of T7E1 frequency data for each target is shown below the histogram for reference (also shown in Fig. 1B). Data represents average of three biological replicates. (B) T7E1 assay for M1, M2, and M6 pools heterocomplexed with a 1:1 mixture of amplicons generated from targeted and untargeted wild type (WT) pools. The %NHEJ represents average of two biological replicates.
Figure 4
Figure 4
CRISPR-Cas9 activity reported by TIDE-Coupled Sanger Sequencing, Next-Generation Sequencing, and IDAA. (A) Indel spectrum and frequency predicted by TIDE, NGS, and IDAA from three pools of edited cells. (B) Comparison of NGS, TIDE, and IDAA for eight edited clones. The most prevalent reads (>5%) by targeted NGS are shown below the sgRNA sequence (5′ to 3′) with corresponding deletions (black dashes) and insertions (red letters). Red arrows identify sgRNA cut sites. The allele frequencies determined by NGS, TIDE, and IDAA are depicted in the adjacent table. Allele frequency and indel identity miscalls by TIDE or IDAA are highlighted in red or blue, respectively. Alignments labelled with an asterisk (*) represent indels with insertions and/or deletions that span beyond the sgRNA area represented.

References

    1. Barrangou, R. & Doudna, J. A. Applications of CRISPR technologies in research and beyond. Nat. Biotechnol. 933–941, 10.1038/nbt.3659 (2016). - PubMed
    1. Kleinstiver BP, et al. Broadening the targeting range of Staphylococcus aureus CRISPR-Cas9 by modifying PAM recognition. Nat. Biotechnol. 2015;33:1293–1298. doi: 10.1038/nbt.3404. - DOI - PMC - PubMed
    1. Ran FA, et al. In vivo genome editing using Staphylococcus aureus Cas9. Nature. 2015;520:186–191. doi: 10.1038/nature14299. - DOI - PMC - PubMed
    1. Anders C, Niewoehner O, Duerst A, Jinek M. Structural basis of PAM-dependent target DNA recognition by the Cas9 endonuclease. Nature. 2014;513:569–573. doi: 10.1038/nature13579. - DOI - PMC - PubMed
    1. Doench, J. G. et al. Optimized sgRNA design to maximize activity and minimize off-target effects of CRISPR-Cas9. Nat. Biotechnol. 10.1038/nbt.3437 (2016). - PMC - PubMed

Publication types