. 2018 Jan 1;8(3):830-845.
doi: 10.7150/thno.22012. eCollection 2018.

Drug Repurposing Screening Identifies Tioconazole as an ATG4 Inhibitor that Suppresses Autophagy and Sensitizes Cancer Cells to Chemotherapy

Affiliations

Drug Repurposing Screening Identifies Tioconazole as an ATG4 Inhibitor that Suppresses Autophagy and Sensitizes Cancer Cells to Chemotherapy

Pei-Feng Liu et al. Theranostics. .

Abstract

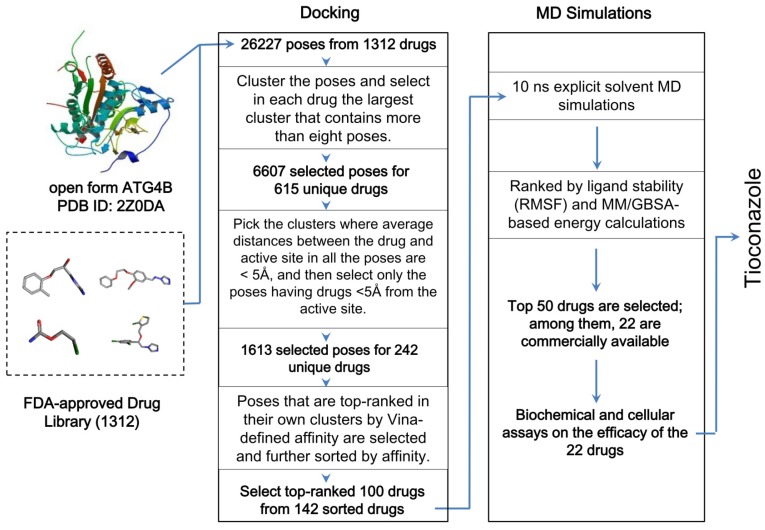
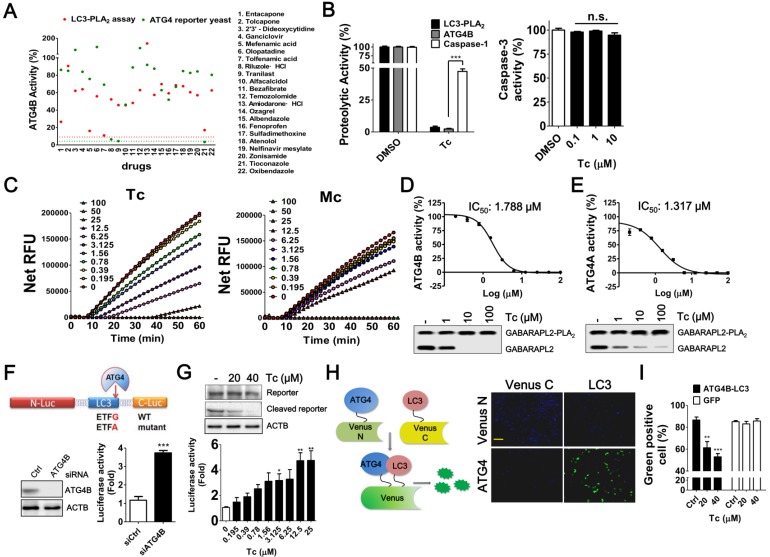
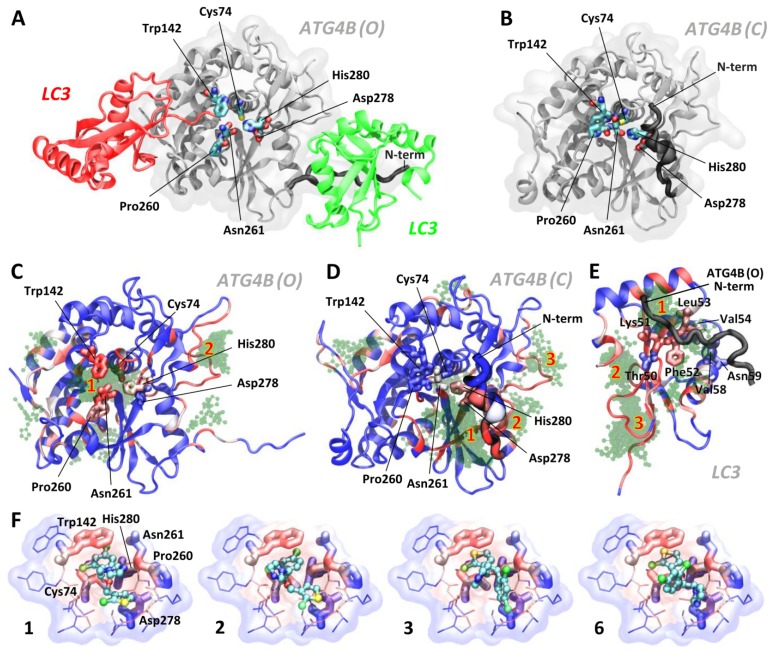
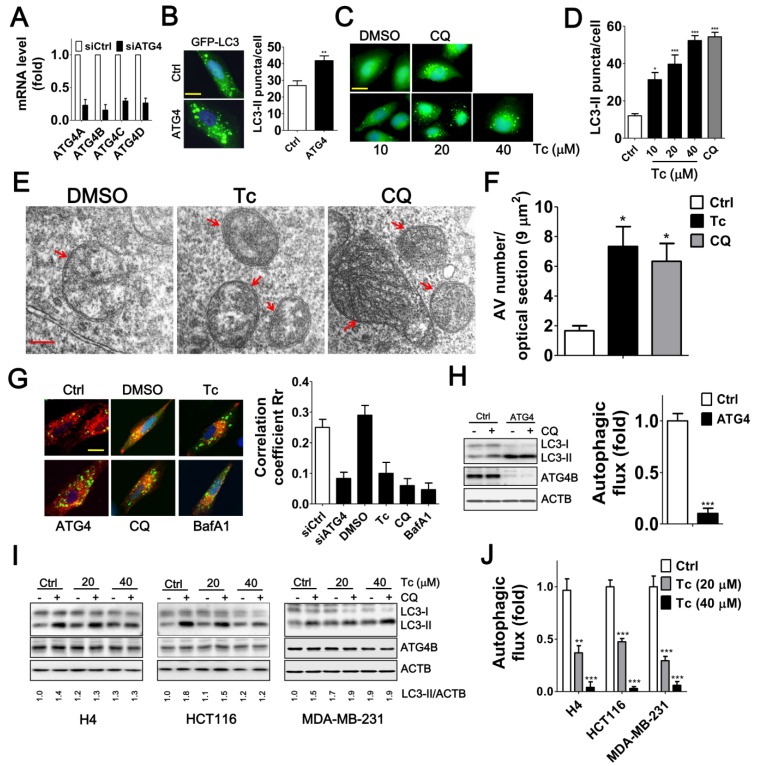
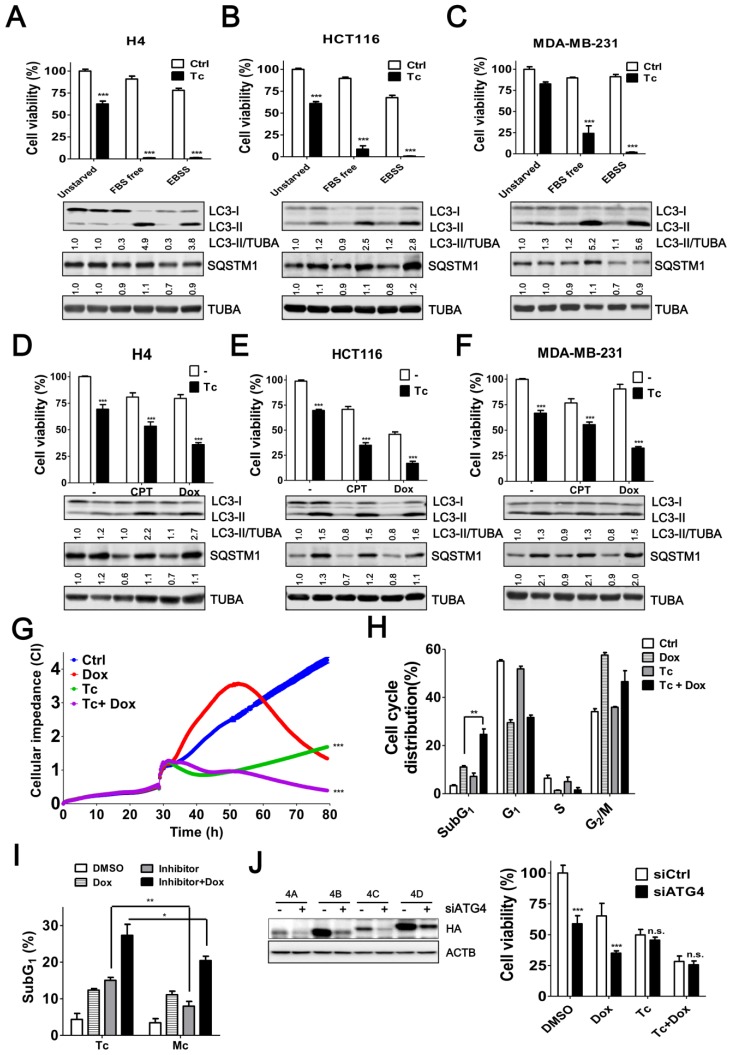
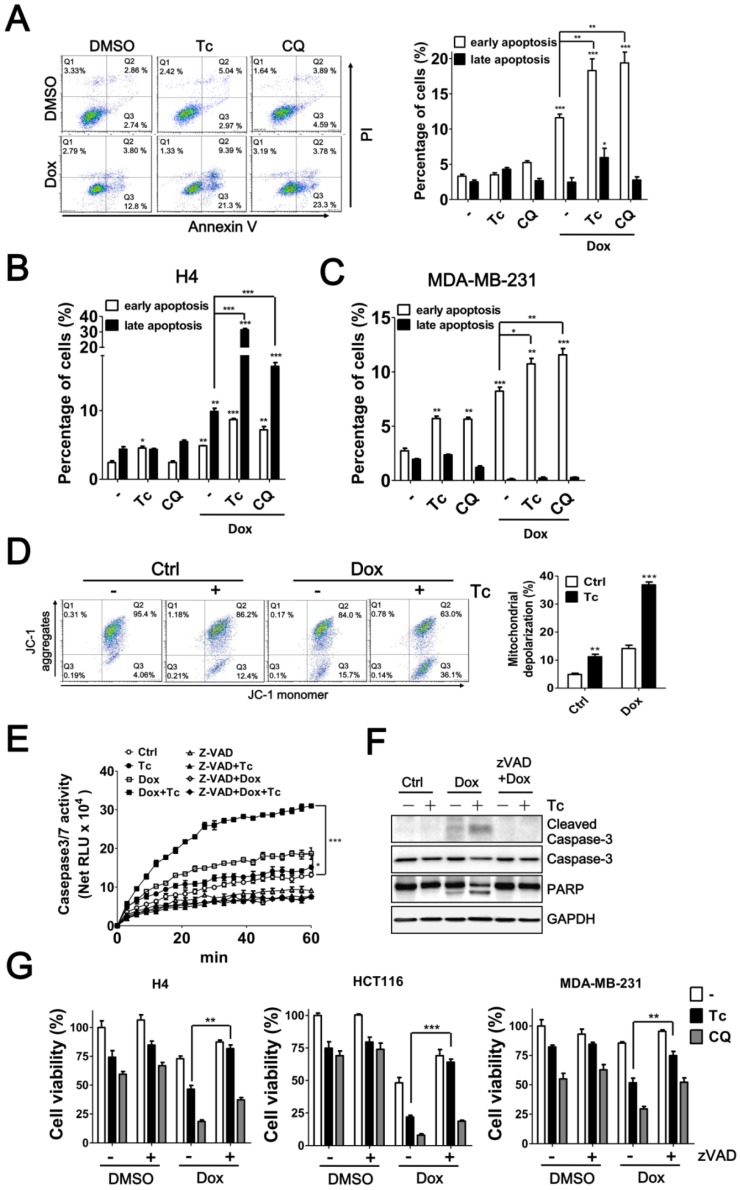
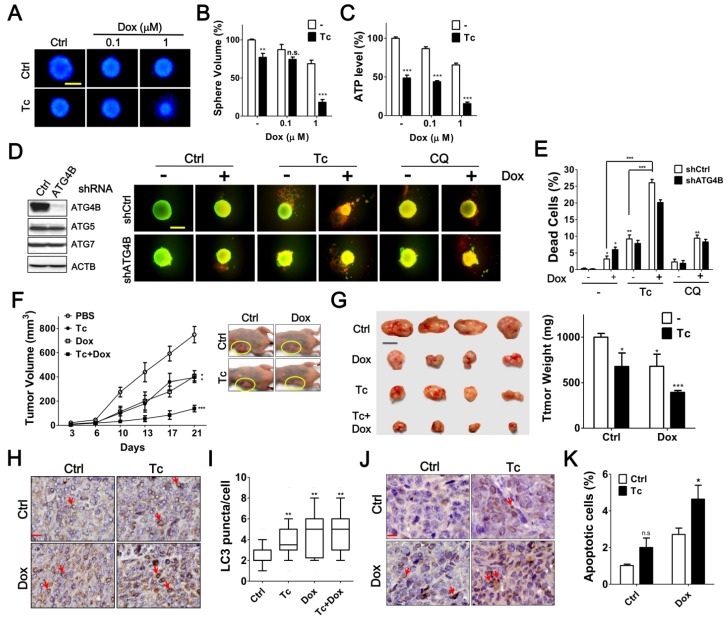
Background: Tumor cells require proficient autophagy to meet high metabolic demands and resist chemotherapy, which suggests that reducing autophagic flux might be an attractive route for cancer therapy. However, this theory in clinical cancer research remains controversial due to the limited number of drugs that specifically inhibit autophagy-related (ATG) proteins. Methods: We screened FDA-approved drugs using a novel platform that integrates computational docking and simulations as well as biochemical and cellular reporter assays to identify potential drugs that inhibit autophagy-required cysteine proteases of the ATG4 family. The effects of ATG4 inhibitors on autophagy and tumor suppression were examined using cell culture and a tumor xenograft mouse model. Results: Tioconazole was found to inhibit activities of ATG4A and ATG4B with an IC50 of 1.3 µM and 1.8 µM, respectively. Further studies based on docking and molecular dynamics (MD) simulations supported that tioconazole can stably occupy the active site of ATG4 in its open form and transiently interact with the allosteric regulation site in LC3, which explained the experimentally observed obstruction of substrate binding and reduced autophagic flux in cells in the presence of tioconazole. Moreover, tioconazole diminished tumor cell viability and sensitized cancer cells to autophagy-inducing conditions, including starvation and treatment with chemotherapeutic agents. Conclusion: Tioconazole inhibited ATG4 and autophagy to enhance chemotherapeutic drug-induced cytotoxicity in cancer cell culture and tumor xenografts. These results suggest that the antifungal drug tioconazole might be repositioned as an anticancer drug or chemosensitizer.

Keywords: ATG4 and autophagy inhibitory drug; Drug repurposing screen; cancer therapy; docking; molecular dynamics simulations..


Conflict of interest statement

Competing Interests: The authors have declared that no competing interest exists.

Figures

Figure 1
Figure 1
Workflow of the in silico drug screening for 1312 FDA-approved drugs. The drugs were docked into the open form of ATG4B, and the results were sorted by clustered poses, distances between drugs and the active site, and the Vina-defined binding affinity. The top-ranked 100 drugs were further screened for their binding stability using 10 ns explicit-solvent MD simulations at body temperature and subsequent MM/GBSA energy calculations. Additional details are provided in the Methods and Supplementary Material.
Figure 2
Figure 2
Screening and Evaluation of Drugs for ATG4 Inhibition. (A) The ability of the 22 hits obtained from the in silico drug screening to inhibit ATG4 was evaluated using LC3-PLA2 biochemical assays (red dots) and ATG4 reporter yeast cells (green dots). EGTA (5 mM, red dot line) and NEM (10 mM, green dot line) were used as positive controls for biochemical and cellular ATG4 reporter assays, respectively. (B) Tioconazole (Tc, 2.5 μM) was confirmed with ATG4 reporter yeast cells and LC3-PLA2 biochemical assay and counter assayed with caspase-1 reporter yeast cells for selectivity (left panel). Various concentrations of Tc were mixed with 0.5 nM caspase-3 and 100 μM Ac-DEVD-AFC to determine the effects of Tc on the caspase-3 activity (right panel). (C) The activities of 2-fold serially titrated Tc and its analog miconazole (Mc) on ATG4B were compared with an LC3-PLA2 assay. (D) ATG4B (0.1 nM) or (E) ATG4A (5 nM) were mixed with 2-fold serially diluted Tc and 100 nM GABARAPL2-PLA2 to determine the IC50 of Tc for ATG4 members. Quantitative results are shown in each panel (n=4). (D) ATG4B (1 nM) or (E) ATG4A (50 nM) were mixed with 10-fold serially diluted Tc and 500 nM GABARAPL2-PLA2 for 1 h. The cleavage of GABARAPL2-PLA2 was validated with immunoblotting using an anti-Myc antibody. (F) The expression vector that encoded ATG4-cleavable luciferase was constructed with LC3 and a luciferase chimera gene, as shown in the schematic diagram (upper panel). HEK293T cells were transfected with scramble siRNA (siCtrl) or siRNA against ATG4B (siATG4B) for 48 h, followed by transfection with the ATG4 reporter vector for 24 h. The luciferase activity was measured with a luminescent reader (n=6), and the knockdown efficiency of ATG4B was determined using immunoblotting. (G) HEK293T cells were transfected overnight with the ATG4 reporter vector as described in (I) and treated with Tc for 8 h to measure the luciferase activity (lower panel). The cleavage of LC3 and luciferase chimera protein by ATG4 in cells treated with Tc or untreated cells was verified via immunoblotting (upper panel). (H) N-terminal Venus fused with ATG4B and C-terminal Venus fused with LC3 were co-transfected into HEK 293T cells. After overnight culture, the cells were fixed to observe Venus complementary under fluorescence microscopy (right panel). Bar: 100 μm. (I) The transfected cells were treated with Tc for 8 h and fixed for flow cytometry to quantify Venus fluorescence using GFP as a counter assay. The results are expressed as the mean ± SEM from at least 3 individual experiments. *p < 0.05; **p < 0.01; ***p < 0.001.
Figure 3
Figure 3
Docking and MD Simulations for Tioconazole Binding to ATG4. (A) The structures of the open/active (PDB code: 2Z0D, ATG4B (O)) and (B) closed/inactive (PDB code: 2CY7, ATG4B (C)) forms of ATG4B are shown in panels A and B (in white), respectively. Together with the open form, LC3 with a cleaved C-terminus docked into the active site (red protein) and LC3 from one of the adjacent crystallographic unit cell (green protein) are shown. The active site of ATG4B consists of the residues Cys74 (the catalytic cysteine), Asp278 and His280, shown in licorice. The adjacent residues, Trp142, Pro260 and Asn261 (in licorice), form a substrate-binding cavity, with the latter two residues located at a regulatory loop that spatially flanks the cavity. Note the differences in the N-terminus positions in the open and closed forms of ATG4B. Panels C, D and E show the 100 docking poses obtained from AutoDock for the active (C) and inactive (D) forms of ATG4B as well as LC3 (E). The residues of LC3 that interact with the N-terminal tail of ATG4B, observed via crystallography and later confirmed by NMR, are shown in thick licorice. Tioconazole is shown as a transparent green ball-and-stick structure, and residues in proteins are color-coded in blue (infrequent) → white → red (frequent) by the number of times they are in contact with ligands for the examined 100 docking poses (within 4 Å). The spatial “regions” that indicate the locations of clustered poses identified by AutoDock (see the rightmost column in Table S1) are numbered in red. The docking results for clusters 1, 2, 3 and 6, rank-ordered, are shown in panel (F). Tioconazole is shown as a ball-and-stick structure, and the active site residues Cys74, Asn278, and His280 as well as the adjacent residues Trp142, Pro260 and Asn261 are presented in thick licorice. Surrounding residues with atoms in close contact (< 4 Å) with tioconazole are shown in thin licorice. Transparent clouds are colored in blue → white → red to show atoms with an increased frequency of contacts with tioconazole, summing all 100 docking poses. Also see Figure S2 and the supplemental movies.
Figure 4
Figure 4
Effects of Tioconazole on Autophagic Activity in Cancer Cells. (A) Human glioma H4 cells that stably express GFP-LC3 were transfected with 5 nM non-targeting siRNA (Ctrl) or siRNA against ATG4 family members (ATG4) for 48 h, and the knockdown efficiency of ATG4 was verified with real time PCR. (B) The knocked-down cells were fixed for observation via fluorescence microscopy, and the number of GFP-LC3 puncta is quantified in the right panel. Bar: 20 μm. (C) The cells that stably express GFP-LC3 were treated with tioconazole for 8 h and fixed to observe the GFP-LC3 puncta, which were (D) quantified via fluorescence microscopy. The autophagy inhibitor CQ was used as a positive control. Bar: 20 μm. (E) HCT16 cells treated with tioconazole (Tc, 40 μM) or CQ (20 μM) for 6 h were fixed and imaged with TEM. Representative autophagic vacuoles (AVs) are shown. Arrowhead: autophagosome. Bar: 200 nm. (F) The numbers of AVs for each optical section (9 μm2) are quantified (n=8). (G) HCT116 cells expressing GFP-LC3 and RFP-Lamp1 were treated with Tc for 6 h and fixed to observe colocalization of GFP-LC3 and RFP-Lamp1 with confocal microscopy. GFP-LC3 that had colocalized with or was surrounded by RFP-Lamp1 was identified as fusion between autophagosomes and lysosomes. The colocalization coefficients of images were quantified by the Ziess LSM 710 Software and are shown in the right panel. Bar: 20 μm. (H) HCT16 cells were transfected with siRNA (5 nM) for 66 h and then treated with CQ (20 μM) for 2 h. Cells were harvested for immunoblotting using antibodies against LC3, ATG4B or ACTB, and autophagy flux was quantified in untreated cells and cells treated with CQ based on changes in LC3-II. (I) H4, HCT116 or MDA-MB-231 cells were treated with Tc for 6 h in the presence (+) or absence (-) of CQ (20 μM) and harvested for immunoblotting. (J) The autophagic flux was quantified as described in (I). Representative data are shown, and the quantified results are expressed as the mean ± SEM from at least 3 individual experiments. *p < 0.05; **p < 0.01; ***p < 0.001.
Figure 5
Figure 5
Tioconazole Sensitizes Cancer Cells to Starvation and Chemotherapeutic Drugs. (A) H4, (B) HCT116 or (C) MDA-MB-231 cells were starved in FBS-free media or EBSS in the presence or absence of tioconazole (40 μM) for 24 h. The cytotoxicity of these treatments was assessed using CellTiter-Glo. (D) H4, (E) HCT116 and (F) MDA-MB-231 cells were treated with the anticancer drug CPT (1.5 μM) or Dox (1 μM) for 24 h in the presence or absence of tioconazole, and cell viability was measured with CellTiter-Glo. The immunoblotting results of LC3-II and SQSTM1 for the cells as aforementioned are shown in each panel. (G) HCT116 cells were cultured in electronic plates and treated with Dox (1 μM) in the presence or absence of Tc (40 μM) to monitor cell viability in live cells with an impedance-based system. (H) HCT116 cells treated with Tc or (I) its analog Mc in the presence or absence of Dox (1 μM) for 24 h were harvested for FACS-based cell cycle distribution analysis or to quantify the subG1 population with FlowJo. (J) HCT116 cells were transfected with 5 nM scramble siRNA (siCtrl) or siRNA against ATG4 (siATG4) for 56 h. The transfected cells were treated with Dox or Tc for 24 h, and the cell viability was measured with CellTiter-Glo. The knockdown efficiency of siRNA against ATG4 was confirmed by immunoblotting in cells transfected with HA-tagged ATG4 members. The results are expressed as the mean ± SEM from 3 individual experiments. n.s., p > 0.05; *p < 0.05; **p < 0.01; ***p < 0.001.
Figure 6
Figure 6
Effects of Tioconazole on Chemotherapy-Induced Apoptosis in Cancer Cells. (A) HCT116, (B) H4 and (C) MDA-MB-231 cells were treated with Dox (1 μM) for 24 h in the presence or absence of tioconazole (Tc, 40 μM), and apoptotic cells were stained with PI/AV. The apoptotic cells were analyzed and quantified with Prism 5.0. (D) The treated cells as in (A) were stained with JC-1 to determine the mitochondrial membrane potential. The representative data and quantitative results are shown in the left and right panels, respectively. (E) Untreated HCT116 cells or HCT116 cells treated with zVAD-FMK (50 μM) as described in (A) were harvested to assess caspase-3 activation with Caspase-Glo 3/7 luminescent assay. (F) HCT116 cells treated as in (C) were harvested for immunoblotting using antibodies against caspase-3 or PARP. (G) H4, HCT116 and MDA-MB-231 cells were pretreated with zVAD-FMK (50 μM), Tc (40 μM) or CQ (20 μM) prior to treatment with Dox (1 μM) for 24 h, and the cell viability was measured. The results are expressed as the mean ± SEM from at least 3 individual experiments. *p < 0.05; **p < 0.01; ***p < 0.001.
Figure 7
Figure 7
Effects of Tioconazole on Chemosensitivity in Tumor Spheroid Culture and Xenograft Mouse Model. (A) HCT116 cells were cultured in an ultra-low attachment dish for 24 h to form spheres. The cells were treated with Dox (1 μM) in the presence or absence of Tc (40 μM) for 48 h and stained with Hoechst 33342 (1 μg/mL) to image the spheres. Scale bar: 400 μm. (B) The relative sphere volume was quantified using DMSO-treated cells as the normalized control. (C) HCT116 sphere-forming cells treated as in (A) were lysed to measure ATP levels and assess cell viability. (D) HCT116 cells harboring shRNA against ATG4B, ATG5 or ATG7 formed spheres and were treated with Tc (40 μM) or CQ (20 μM) in the presence or absence of Dox (1 μM) for 48 h. The viable and dead spheres were imaged with a LIVE/DEAD staining kit. The knockdown efficiency of ATG genes was verified by immunoblotting (left panel) (E) The red fluorescence of the spheres in (D) was quantitated with a reader to assess the dead cell population (n = 6). The quantified results are expressed as the mean ± SEM from 3 individual experiments. (F) Mice injected with 2 × 10⁶ human colorectal cancer HCT116 cells were treated with Tc (60 mg/kg) in the presence (+) or absence (-) of Dox (1 mg/kg) every other day. The tumor volume (circle) in each mouse was measured every 3 to 4 days (5 per group). The p values were determined with an ANOVA. (G) The representative pictures of the xenograft tumors and tumor weight at day 21 after injection are shown in the left and right panels, respectively. Scale bar: 1 cm. (H) The xenografted tumor was harvested and embedded for immunohistochemistry using an antibody against LC3. Arrow: cells with LC3 puncta. Scale bar: 40 μm. (I) The number of LC3 puncta in each cell was counted for at least 150 cells and quantified. (J) The level of cleaved caspase-3 in sections prepared as in (H) was determined with immunohistochemistry as shown in the left panel. Arrow: apoptotic cell. Scale bar: 20 μm. n.s. (K) The cleaved caspase-3-positive cells with condensed nuclei were counted as apoptotic cells. The quantified results were obtained from at least 1500 cells and are shown in the right panel. p > 0.05; *p < 0.05; **p < 0.01; ***p < 0.001.

References

    1. Mizushima N, Klionsky DJ. Protein turnover via autophagy: implications for metabolism. Annu Rev Nutr. 2007;27:19–40. - PubMed
    1. Galluzzi L, Pietrocola F, Bravo-San Pedro JM, Amaravadi RK, Baehrecke EH, Cecconi F. et al. Autophagy in malignant transformation and cancer progression. EMBO J. 2015;34:856–80. - PMC - PubMed
    1. Jiang P, Mizushima N. Autophagy and human diseases. Cell Res. 2014;24:69–79. - PMC - PubMed
    1. Renna M, Jimenez-Sanchez M, Sarkar S, Rubinsztein DC. Chemical inducers of autophagy that enhance the clearance of mutant proteins in neurodegenerative diseases. J Biol Chem. 2010;285:11061–7. - PMC - PubMed
    1. Abedin MJ, Wang D, McDonnell MA, Lehmann U, Kelekar A. Autophagy delays apoptotic death in breast cancer cells following DNA damage. Cell Death Differ. 2007;14:500–10. - PubMed

Publication types

MeSH terms