. 2018 Feb;52(2):337-366.
doi: 10.3892/ijo.2017.4228. Epub 2017 Dec 15.

Vitamin D derivatives potentiate the anticancer and anti-angiogenic activity of tyrosine kinase inhibitors in combination with cytostatic drugs in an A549 non-small cell lung cancer model

Affiliations

Vitamin D derivatives potentiate the anticancer and anti-angiogenic activity of tyrosine kinase inhibitors in combination with cytostatic drugs in an A549 non-small cell lung cancer model

Ewa Maj et al. Int J Oncol. 2018 Feb.

Abstract

Numerous in vitro and in vivo studies have demonstrated that calcitriol [1,25(OH)2D3] and different vitamin D analogs possess antineoplastic activity, regulating proliferation, differentiation and apoptosis, as well as angiogenesis. Vitamin D compounds have been shown to exert synergistic effects when used in combination with different agents used in anticancer therapies in different cancer models. The aim of this study was to evaluate the mechanisms of the cooperation of the vitamin D compounds [1,24(OH)2D3 (PRI‑2191) and 1,25(OH)2D3] with tyrosine kinase inhibitors (imatinib and sunitinib) together with cytostatics (cisplatin and docetaxel) in an A549 non-small cell lung cancer model. The cytotoxic effects of the test compounds used in different combinations were evaluated on A549 lung cancer cells, as well as on human lung microvascular endothelial cells (HLMECs). The effects of such combinations on the cell cycle and cell death were also determined. In addition, changes in the expression of proteins involved in cell cycle regulation, angiogenesis and the action of vitamin D were analyzed. Moreover, the effects of 1,24(OH)2D3 on the anticancer activity of sunitinib and sunitinib in combination with docetaxel were examined in an A549 lung cancer model in vivo. Experiments aiming at evaluating the cytotoxicity of the combinations of the test agents revealed that imatinib and sunitinib together with cisplatin or docetaxel exerted potent anti-proliferative effects in vitro on A549 lung cancer cells and in HLMECs; however, 1,24(OH)2D3 and 1,25(OH)2D3 enhanced the cytotoxic effects only in the endothelial cells. Among the test agents, sunitinib and cisplatin decreased the secretion of vascular endothelial growth factor (VEGF)‑A from the A549 lung cancer cells. The decrease in the VEGF‑A level following incubation with cisplatin correlated with a higher p53 protein expression, while no such correlation was observed following treatment of the A549 cells with sunitinib. Sunitinib together with docetaxel and 1,24(OH)2D3 exhibited a more potent anticancer activity in the A549 lung cancer model compared to double combinations and to treatment with the compounds alone. The observed anticancer activity may be the result of the influence of the test agents on the process of tumor angiogenesis, for example, through the downregulation of VEGF‑A expression in tumor and also on the induction of cell death inside the tumor.


Figures

Figure 1
Figure 1
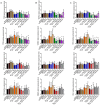
Antiproliferative activity of GV, SU, CIS, DTX, PRI-2191 and/or calcitriol against A549 lung cancer cells. A549 cells were exposed to combinations of the test compounds at different concentrations for 72 h: N, TKI and CYT were used at their respective IC50 concentrations; 0.5 N, half of IC50; 0.25 N, a quarter of IC50; PRI-2191 and calcitriol were used at constant concentration of 100 nM. Bars represent the means ± SD; *p<0.05, compared with TKI, TKI + vit, CYT, CYT + vit; **p<0.05, compared with TKI and TKI + vit; +p<0.05, compared with TKI; #p<0.05, compared with TKI and CYT and CYT + vit; $p<0.05, compared with CYT and CYT + vit (one-way ANOVA, Fisher's test). GV, imatinib; SU, sunitinib; CIS, cisplatin; DTX, docetaxel; vit, vitamin D compound [PRI-2191, 1,24(OH)2D3; Calcitriol, 1,25(OH)2D3]; TKI, tyrosine kinase inhibitor.
Figure 2
Figure 2
Anti-proliferative activity of GV and SU with DTX and/or with PRI-2191 against A549 lung cancer cells. DTX was used at concentration a 10-fold lower concentration than the calculated IC50 value. Bars represent the means ± SD; *p<0.05, compared with TKI, TKI + vit, CYT, CYT + vit; **p<0.05, compared with TKI and TKI + vit (GV + DTX only compared to GV); +p<0.05, compared with TKI (one-way ANOVA, Fisher's test). GV, imatinib; SU, sunitinib; DTX, docetaxel; vit, vitamin D compound [PRI-2191, 1,24(OH)2D3]; TKI, tyrosine kinase inhibitor.
Figure 3
Figure 3
Anti-proliferative activity of GV, SU, CIS, DTX, PRI-2191 and/or calcitriol against human lung microvascular endothelial cells (HLMECs). HLMECs were exposed to combinations of the test compounds at different concentrations for 72 h: N, TKI and CYT were used at their respective IC50 values; 0.5 N, half of IC50; 0.25 N, a quarter of IC50; PRI-2191 and calcitriol were used at a constant concentration of 100 nM. Bars represent the means ± SD; *p<0.05, compared with TKI, TKI + vit, CYT, CYT + vit; +p<0.05, compared with TKI; #p<0.05, compared with TKI, CYT and CYT + vit; δp<0.05, compared with TKI, TKI + vit and CYT; $p<0.05, compared with CYT and CYT + vit; %p<0.05, compared with TKI, CYT, CYT + vit and TKI + CYT (one-way ANOVA, Fisher's test). GV, imatinib; SU, sunitinib; CIS, cisplatin; DTX, docetaxel; vit, vitamin D compound [PRI-2191, 1,24(OH)2D3; Calcitriol, 1,25(OH)2D3]; TKI, tyrosine kinase inhibitor.
Figure 4
Figure 4
Cell cycle analysis of A549 lung cancer cells after 72 h of incubation with GV, SU, CIS, DTX and/or PRI-2191 or calcitriol. Bars represent the means ± SD. *p<0.05 compared with control; #p<0.05, compared with control and CIS or DTX and GV or SU; δp<0.05, compared with GV and DTX; $p<0.05, compared with GV; &p<0.05, compared with DTX (one-way ANOVA, Fisher's test). GV, imatinib; SU, sunitinib; CIS, cisplatin; DTX, docetaxel; PRI-2191, 1,24(OH)2D3; Calcitriol, 1,25(OH)2D3.
Figure 5
Figure 5
Cell cycle analysis of human lung microvascular endothelial cells (HLMECs) after 72 h of incubation with GV, SU, CIS, DTX and/or PRI-2191 or calcitriol. Bars represent the means ± SD. *p<0.05, compared with control; #p<0.05, compared with control and CIS or DTX and GV or SU; δp<0.05, compared with control and GV or SU; $p<0.05, compared with GV or SU (one-way ANOVA, Fisher's test). GV, imatinib; SU, sunitinib; CIS, cisplatin; DTX, docetaxel; PRI-2191, 1,24(OH)2D3; Calcitriol, 1,25(OH)2D3.
Figure 6
Figure 6
Caspase-3 activity in A549 cells after 72 h of incubation with the tested combinations of TKIs, CYT and vitamin D compounds. Bars represent the means ± SD. *p<0.05, compared with control; **p<0.05, compared with control, TKI, and CYT; #p<0.05, compared with control and CYT + vit; δp<0.05, compared with control and TKI + vit; $p<0.05, compared with TKI; &p<0.05, compared with TKI and CYT (one-way ANOVA, Fisher's test). GV, imatinib; SU, sunitinib; CIS, cisplatin; DTX, docetaxel; TKI, tyrosine kinase inhibitor; CYT, cytostatic drug; vit, vitamin D compound [PRI-2191, 1,24(OH)2D3; Calcitriol, 1,25(OH)2D3].
Figure 7
Figure 7
Caspase-3 activity in human lung microvascular endothelial cells (HLMECs) after 72 h of incubation with the tested combinations of TKIs, CYT and vitamin D compounds. Bars represent the means ± SD. *p<0.05, compared with control and TKI; **p<0.05, compared with control, TKI and CYT (one-way ANOVA, Fisher's test). GV, imatinib; SU, sunitinib; CIS, cisplatin; DTX, docetaxel; TKI, tyrosine kinase inhibitor; CYT, cytostatic drug; PRI-2191, 1,24(OH)2D3; Calcitriol, 1,25(OH)2D3.
Figure 8
Figure 8
VEGF-A secretion by A549 lung cancer cells in vitro following treatment with GV, SU, CIS, DTX, PRI-2191 and/or calcitriol. Bars represent the means ± SD. VEGF-A level was normalized to the number of cells assessed indirectly using sulforhodamine B (SRB) assay. *p<0.05, compared with control; **p<0.05, compared with control and TKI; &p<0.05, compared with TKI; #p<0.05, compared with control and CYT; δp<0.05, compared with control, TKI, and CYT (one-way ANOVA, Fisher's test). GV, imatinib; SU, sunitinib; CIS, cisplatin; DTX, docetaxel; TKI, tyrosine kinase inhibitor; CYT, cytostatic drug; PRI-2191, 1,24(OH)2D3; Calcitriol, 1,25(OH)2D3.
Figure 9
Figure 9
Inhibition of the proliferation of A549 cells after 72 h of incubation with GV, SU, CIS, DTX, PRI-2191 and/or calcitriol, followed by 48 h of culture in medium without FBS. Bars represent the means ± SD. *p<0.05, compared with EtOH/DMSO and vitamin D compounds; **p<0.05, compared with EtOH/DMSO, vitamin D compounds, and TKI; #p<0.05, compared with EtOH/DMSO, vitamin D compounds, TKI, and CYT (one-way ANOVA, Fisher's test). GV, imatinib; SU, sunitinib; CIS, cisplatin; DTX, docetaxel; TKI, tyrosine kinase inhibitor; CYT, cytostatic drug; PRI-2191, 1,24(OH)2D3; Calcitriol, 1,25(OH)2D3
Figure 10
Figure 10
Effect of GV, SU, CIS, DTX, PRI-2191 and calcitriol on (A) p53 and (B) p21 expression in A549 cells. Densitometric analysis was performed using ImageJ 1.46v software; the results were normalized to actin; bars represent the means ± SD, n=2–3 repeats. *p<0.05, compared with control cells and TKI; **p<0.05, compared with control cells, TKI, and CYT (one-way ANOVA, Fisher's test). Beneath the bar charts, representative immunoblots are presented. Note that not all the data samples were run continuously in adjacent lanes in the same gel, as portrayed in the figure. GV, imatinib; SU, sunitinib; CIS, cisplatin; DTX, docetaxel; PRI-2191, 1,24(OH)2D3; Calcitriol, 1,25(OH)2D3.
Figure 11
Figure 11
Effect of SU, CIS, DTX and PRI-2191 and their combinations on p53 expression and localization in A549 cells. A549 cells cultured on a coverglass were incubated with the tested combinations for 72 h, then fixed, permeabilized and stained for p53 (FITC) and nuclear staining (DAPI). Representative images of the combinations of SU with CIS and DTX and PRI-2191 are shown. SU, sunitinib; CIS, cisplatin; DTX, docetaxel; PRI-2191, 1,24(OH)2D3.
Figure 11
Figure 11
Effect of SU, CIS, DTX and PRI-2191 and their combinations on p53 expression and localization in A549 cells. A549 cells cultured on a coverglass were incubated with the tested combinations for 72 h, then fixed, permeabilized and stained for p53 (FITC) and nuclear staining (DAPI). Representative images of the combinations of SU with CIS and DTX and PRI-2191 are shown. SU, sunitinib; CIS, cisplatin; DTX, docetaxel; PRI-2191, 1,24(OH)2D3.
Figure 12
Figure 12
Effect of GV, SU, CIS, DTX, PRI-2191 and calcitriol on (A) VDR and (B) CYP24 expression in A549 cells. Densitometric analysis was performed using ImageJ 1.46v software; the results were normalized to actin; bars represent the means ± SD, n=3 repeats. *p<0.05, compared with control; **p<0.05, compared with control and TKI; #p<0.05, compared with CYT; δp<0.05, compared with TKI; &p<0.05, compared with TKI + CYT; $p<0.05, compared with, TKI, CYT, and TKI + CYT (one-way ANOVA, Fisher's test). (C) Beneath the bar charts, representative immunoblots are presented. Note that not all the data samples were run continuously in adjacent lanes in the same gel, as portrayed in the figure. PRI-2191, 1,24(OH)2D3; Calcitriol, 1,25(OH)2D3.
Figure 13
Figure 13
Effect of GV, SU, CIS, DTX, PRI-2191 and calcitriol on (A) VDR and (B) CYP24 expression in human lung microvascular endothelial cells (HLMECs). Densitometric analysis was performed using ImageJ 1.46v software; the results were normalized to actin; bars represent the means ± SD, n=3 repeats. *p<0.05, compared with control; **p<0.05, compared with control and TKI; ***p<0.05, compared with vitamin D compounds; #p<0.05, compared with CYT; $p<0.05, compared with, TKI, CYT and TKI + CYT (one-way ANOVA, Fisher's test). (C) Beneath the bar charts, representative immunoblots are presented. Note that not all the data samples were run continuously in adjacent lanes in the same gel, as portrayed in the figure. PRI-2191, 1,24(OH)2D3; Calcitriol, 1,25(OH)2D3.
Figure 14
Figure 14
Real-time PCR analysis of (A) TP53, (B) VEGFA and (C) MYC levels in A549 cells after 72 h of incubation with GV, SU, CIS, DTX, PRI-2191 and calcitriol and their combinations. Bars represent relative quantification (RQ) calculated in Expression Suite v1.0.3 software with the ΔΔCt method. (A) *p<0.05, compared with control; **p<0.05, compared with TKI; #p<0.05, compared with control and CYT; δp<0.05, compared with CYT; (B) #p<0.05, compared with control; *p<0.05, compared with SU and SU + calcitriol; **p<0.05, compared with SU + calcitriol; (C) *p<0.05, compared with control; **p<0.05, compared with SU and SU + vit; #p<0.05, compared with SU + calcitriol (one-way ANOVA, Fisher's test). GV, imatinib; SU, sunitinib; CIS, cisplatin; DTX, docetaxel; TKI, tyrosine kinase inhibitor; CYT, cytostatic drug; vit, vitamin D compound (PRI-2191, 1,24(OH)2D3; Calcitriol, 1,25(OH)2D3).
Figure 15
Figure 15
Antitumor activity of SU, DTX and vitamin D analog PRI-2191 in an A549 lung cancer model in vivo. SU was administered at the dose of 40 mg/kg/body weight daily, DTX at 5 mg/kg/body weight once a week, and PRI-2191 at 1 μg/kg/body weight 3 times a week. (A) Kinetics of A549 tumor growth in all experimental groups; (B) comparison of groups receiving SU alone or in combination with DTX and/or PRI-2191; (C) body weight loss of mice bearing A549 tumors treated with SU, DTX, and/or vitamin D analog PRI-219; (D) comparison of tumor mass on the final day of the experiment [day (D)51]; *p<0.05, compared to PRI-2191; #p<0.05, compared to control and PRI-2191 group; **p<0.05, compared to control, PRI-2191, DTX + PRI-2191, and DTX (Kruskal-Wallis test); (E) comparison of calcium concentration in serum collected from mice bearing A549 tumors on the final day of the experiment (D51) treated with SU, DTX, and/or vitamin D analog PRI-2191 alone or in combinations, *p<0.05, compared to control group and DTX; **p<0.05, compared to control group, DTX, SU and SU + DTX, #p<0.05, compared to SU (Tukey's test). SU, sunitinib; DTX, docetaxel; PRI-2191, 1,24(OH)2D3.
Figure 16
Figure 16
(A) VEGF-A and (B) PDGF-BB expression in A549 tumor lysates harvested from mice treated with SU, DTX, and PRI-2191 at the end of the experiment (D51). VEGF-A and PDGF-BB levels were normalized to the total protein concentration; bars represent the means ± SD; *p<0.05, compared to DTX; #p<0.05, compared to control group (one-way ANOVA followed by Fisher's test) (n=4 lysates in each group). SU, sunitinib; DTX, docetaxel; PRI-2191, 1,24(OH)2D3.
Figure 17
Figure 17
(A) Vitamin D receptor (VDR), (B) 1α-hydroxylase (CYP27B1), (C) 24-hydroxylase of vitamin D (CYP24), (D) NF-κB, (E) IκB, (F) PTEN, (G) Bcl-2 and (H) Bax expression in A549 tumor lysates harvested from mice treated with SU, DTX and vitamin D analog PRI-2191 at the end of experiment (D51). Densitometric analysis was performed in ImageJ 1.46v software; blots were normalized to actin; means ± SD, n=3–4 lysates in each group; (B) *p<0.05, compared to SU, PRI-2191, and SU + DTX + PRI-2191; (C) *p<0.05, compared to DTX, SU + PRI-2191, DTX + PRI-2191 and SU + DTX; (D) #p<0.05, compared to PRI-2191; *p<0.05, compared to control and PRI-2191; **p<0.05, compared to control, DTX, PRI-2191 and DTX + PRI-2191; (E) *p<0.05, compared to control, SU, SU + PRI-2191 and DTX + PRI-2191; (F) *p<0.05, compared to control, DTX, SU, SU + PRI-2191, SU + DTX and SU + DTX + PRI-2191; **p<0.05, compared to all groups receiving SU (alone or in combinations with DTX and PRI-2191); (H) *p<0.05, compared to control, DTX, SU and PRI-2191, DTX + PRI-2191 and SU + PRI-2191 (only for SU + DTX + PRI-2191) (one-way ANOVA followed by Fisher's test). Beneath the bar charts representative immunoblots are presented. SU, sunitinib; DTX, docetaxel; PRI-2191, 1,24(OH)2D3.

References

    1. Adler I. Primary Malignant Growths of the Lungs and Bronchi; A Pathological and Clinical Study. Longmans; Green, New York, NY: 1912.
    1. Debakey M. Carcinoma of the lung and tobacco smoking: A historical perspective. Ochsner J. 1999;1:106–108. - PMC - PubMed
    1. Proctor RN. The history of the discovery of the cigarette-lung cancer link: Evidentiary traditions, corporate denial, global toll. Tob Control. 2012;21:87–91. doi: 10.1136/tobaccocontrol-2011-050338. - DOI - PubMed
    1. Dubey AK, Gupta U, Jain S. Epidemiology of lung cancer and approaches for its prediction: A systematic review and analysis. Chin J Cancer. 2016;35:71. doi: 10.1186/s40880-016-0135-x. - DOI - PMC - PubMed
    1. Siegel RL, Miller KD, Jemal A. Cancer statistics, 2016. CA Cancer J Clin. 2016;66:7–30. doi: 10.3322/caac.21332. - DOI - PubMed

MeSH terms