A microfluidic chip with a staircase pH gradient generator, a packed column and a fraction collector for chromatofocusing of proteins
- PMID: 29345313
- PMCID: PMC5947739
- DOI: 10.1002/elps.201700341
A microfluidic chip with a staircase pH gradient generator, a packed column and a fraction collector for chromatofocusing of proteins
Abstract
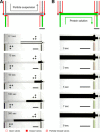
A microfluidic device for pH gradient chromatofocusing is presented, which performs creation of a micro-column, pH gradient generation, and fraction collection in a single device. Using a sieve micro-valve, anion exchange particles were packed into a microchannel in order to realize a solid-phase absorption column. To fractionate proteins according to their isoelectric points, elution buffer solutions with a stepwise pH gradient were prepared in 16 parallel mixing reactors and flowed through the micro-column, wherein a protein mixture was previously loaded. The volume of the column is only 20 nL, hence it allows extremely low sample consumption and fast analysis compared with a conventional system. We demonstrated separation of two proteins, albumin-fluorescein isothiocyanate conjugate (FITC-BSA) and R-Phycoerythrin (R-PE), by using a microcolumn of commercial charged polymeric particles (Source 15Q). The microfluidic device can be used as a rapid diagnostic tool to analyse crude mixtures of proteins or nucleic acids and determine adsorption/desorption characteristics of various biochemical products, which can be helpful for scientific fundamental understanding as well as instrumental in various industrial applications, especially in early stage screening and process development.
Keywords: Microfluidics; Protein separation; pH gradient chromatofocusing.
© 2018 The Authors Electrophoresis Published by WILEY-VCH Verlag GmbH & Co. KGaA, Weinheim.
Figures


References
-
- Whitesides, G. M. , Nature 2006, 442, 368–373. - PubMed
-
- Manz, A. , Effenhauser, C. S. , Burggraf, N. , Harrison, D. J. , Seiler, K. , Fluri, K. , J. Micromechan. Microengin. 1994, 4, 257.
-
- McClain, M. A. , Culbertson, C. T. , Jacobson, S. C. , Allbritton, N. L. , Sims, C. E. , Ramsey, J. M. , Analytical Chem. 2003, 75, 5646–5655. - PubMed
-
- Luckarift, H. R. , Ku, B. S. , Dordick, J. S. , Spain, J. C. , Biotechnol. Bioengin. 2007, 98, 701–705. - PubMed
Publication types
MeSH terms
Substances
LinkOut - more resources
Full Text Sources
Other Literature Sources

