

Haplotype-based genotyping-by-sequencing in oat genome research
- PMID: 29345800
- PMCID: PMC6041447
- DOI: 10.1111/pbi.12888
Haplotype-based genotyping-by-sequencing in oat genome research
Abstract
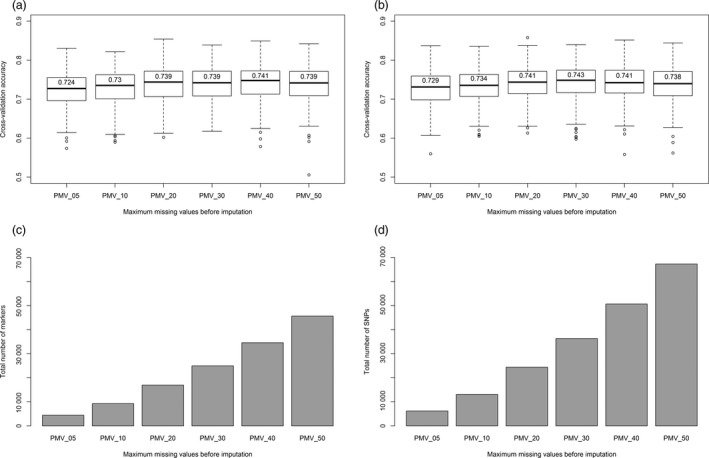
In a de novo genotyping-by-sequencing (GBS) analysis of short, 64-base tag-level haplotypes in 4657 accessions of cultivated oat, we discovered 164741 tag-level (TL) genetic variants containing 241224 SNPs. From this, the marker density of an oat consensus map was increased by the addition of more than 70000 loci. The mapped TL genotypes of a 635-line diversity panel were used to infer chromosome-level (CL) haplotype maps. These maps revealed differences in the number and size of haplotype blocks, as well as differences in haplotype diversity between chromosomes and subsets of the diversity panel. We then explored potential benefits of SNP vs. TL vs. CL GBS variants for mapping, high-resolution genome analysis and genomic selection in oats. A combined genome-wide association study (GWAS) of heading date from multiple locations using both TL haplotypes and individual SNP markers identified 184 significant associations. A comparative GWAS using TL haplotypes, CL haplotype blocks and their combinations demonstrated the superiority of using TL haplotype markers. Using a principal component-based genome-wide scan, genomic regions containing signatures of selection were identified. These regions may contain genes that are responsible for the local adaptation of oats to Northern American conditions. Genomic selection for heading date using TL haplotypes or SNP markers gave comparable and promising prediction accuracies of up to r = 0.74. Genomic selection carried out in an independent calibration and test population for heading date gave promising prediction accuracies that ranged between r = 0.42 and 0.67. In conclusion, TL haplotype GBS-derived markers facilitate genome analysis and genomic selection in oat.
Keywords: Avena sativa; genomics-assisted breeding; genotyping-by-sequencing; haplotype.
© 2018 The Authors. Plant Biotechnology Journal published by Society for Experimental Biology and The Association of Applied Biologists and John Wiley & Sons Ltd.
Conflict of interest statement
The authors have no conflict of interest to declare.
Figures


References
-
- Asoro, F.G. , Newell, M.A. , Beavis, W.D. , Scott, M.P. and Jannink, J.‐L. (2011) Accuracy and training population design for genomic selection on quantitative traits in elite North American oats. Plant Genome 4, 132–144.
-
- Barrett, J.C. , Fry, B. , Maller, J. and Daly, M.J. (2005) Haploview: analysis and visualization of LD and haplotype maps. Bioinformatics 21, 263–265. - PubMed
MeSH terms
Grants and funding
LinkOut - more resources
Full Text Sources
Other Literature Sources
