. 2018 Feb 20;57(7):1249-1261.
doi: 10.1021/acs.biochem.7b01048. Epub 2018 Feb 1.

Prediction of Hot Spots at Myeloid Cell Leukemia-1-Inhibitor Interface Using Energy Estimation and Alanine Scanning Mutagenesis

Affiliations

Prediction of Hot Spots at Myeloid Cell Leukemia-1-Inhibitor Interface Using Energy Estimation and Alanine Scanning Mutagenesis

Parthiban Marimuthu et al. Biochemistry. .

Abstract

Myeloid cell leukemia 1 (Mcl1) is an antiapoptotic protein that plays central role in apoptosis regulation. Also, Mcl1 has the potency to resist apoptotic cues resulting in up-regulation and cancer cell protection. A molecular probe that has the potential to specifically target Mcl1 and thereby provoke its down-regulatory activity is very essential. The aim of the current study is to probe the internal conformational dynamics of protein motions and potential binding mechanism in response to a series of picomolar range Mcl1 inhibitors using explicit-solvent molecular dynamics (MD) simulations. Subsequently, domain cross-correlation and principal component analysis was performed on the snapshots obtained from the MD simulations. Our results showed significant differences in the internal conformational dynamics of Mcl1 with respect to binding affinity values of inhibitors. Further, the binding free energy estimation, using three different samples, was performed on the MD simulations and revealed that the predicted energies (ΔGmmgbsa) were in good correlation with the experimental values (ΔGexpt). Also, the energies obtained using all sampling models were efficiently ranked. Subsequently, the decomposition energy analysis highlighted the major energy-contributing residues at the Mcl1 binding pocket. Computational alanine scanning performed on high energy-contributing residues predicted the hot spot residues. The dihedral angle analysis using MD snapshots on the predicted hot spot residue exhibited consistency in side chain conformational motion that ultimately led to strong binding affinity values. The findings from the present study might provide valuable guidelines for the design of novel Mcl1 inhibitors that might significantly improve the specificity for new-generation chemotherapeutic agents.


Conflict of interest statement

The authors declare no competing financial interest.

Figures
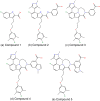
Figure 1
Figure 1
2D-chemical structures of high affinity 2-indole amide inhibitor series.
Figure 2
Figure 2
(a) The overlay of low energy poses of 2-indole amide inhibitor series bound to the hydrophobic binding pocket of Mcl1 (left) obtained from docking studies. The magnified image shows the docking cluster of 2-indole amide inhibitor series (right). (b) Relative binding position of compound 5 to BimBH3 peptide (2PQK) at the hydrophobic binding pocket (blue) of Mcl1 (light gray). The compound 5 interacts to the P2 subpocket present in the hydrophobic groove of Mcl1.
Figure 3
Figure 3
Binding mode of 2-indole amide inhibitor series (stick representation) interacting with the hydrophobic groove of Mcl1 (molecular surface representation). All five inhibitors occupied the shallow P2 subpocket present in the hydrophobic groove of Mcl1. The charged region over Mcl1 surface is highlighted by blue (positive) and red (negative) color.
Figure 4
Figure 4
Root-mean-square deviation (rmsd) values obtained for the Cα atoms of ligand free and ligand bound states of Mcl1 relative to its initial coordinates during MD simulations.
Figure 5
Figure 5
Root-mean-squared fluctuation (rmsf) values obtained for the Cα atoms of ligand free and ligand bound states of Mcl1 relative to its initial coordinates during MD simulations.
Figure 6
Figure 6
Domain cross correlation analysis performed on all Cα atom pairs of Mcl1 complexed with 2-indole amide inhibitor series of compound 1 to 5 (a–e).
Figure 7
Figure 7
Principle Component Analysis for Mcl1–inhibitor complexes. (a) The eigenvalues plotted against eigenvector indices from the Cα covariance matrices. (b) Internal fluctuation obtained for first eigenvector obtained for Mcl1–inhibitor complexes. Superposition of Mcl1 (light brown) complexed with compound 5 (cyan color) over (c) Mcl1 (green) with compound 1, (d) Mcl1 (pink) with compound 2, (e) Mcl1 (purple) with compound 3 and (f) Mcl1 (yellow) with compound 4.
Figure 8
Figure 8
Correlation coefficient (R2) values plotted for experimental (ΔGbind = −RT ln(Ki)) versus predicted (ΔGmmgbsa in kcal/mol) BFE values. The predicted BFE values were produced using three different igb parameters.
Figure 9
Figure 9
Comparison of BFEs (kcal/mol) for Mcl1 interfacing residues with 2-indole amide series of inhibitor. Mean values ± SD from decomposition analysis of MD simulations.
Figure 10
Figure 10
Binding site residues of Mcl1 complexed with 2-indole amide inhibitor series.
Figure 11
Figure 11
Distribution of BFE (kcal/mol) values depicted over the residues at the P2 binding pocket of Mcl1 (molecular surface representation) complexed with compound 5.
Figure 12
Figure 12
In silico alanine screening performed on major energy contributing residues (a–c). The bar graph plotted for BFEs (kcal/mol) obtained for wild-type and the in silico mutants. (d) Comparison of energy difference between wild-type and in silico mutants. Consistency in energy pattern, high energy, observed for F270 in all three complexes, in comparison with other three mutants. Mean values ± SD from decomposition analysis of MD simulations.
Figure 13
Figure 13
Dihedral angle (chi (χ1), deg) measured for the side chain residue F270 in complex 15 during MD simulation.
Figure 14
Figure 14
Energy landscape contour map depicted using the backbone angle ψ and φ for F270 in complex 15 (a–e) during MD simulation.

Similar articles

Cited by

References

    1. Reed J. C.; Miyashita T.; Takayama S.; Wang H. G.; Sato T.; Krajewski S.; Aime-Sempe C.; Bodrug S.; Kitada S.; Hanada M. (1996) BCL-2 family proteins: regulators of cell death involved in the pathogenesis of cancer and resistance to therapy. J. Cell. Biochem. 60, 23–32. 10.1002/(SICI)1097-4644(19960101)60:1<23::AID-JCB5>3.0.CO;2-5. - DOI - PubMed
    1. Marimuthu P.; Singaravelu K. (2017) Deciphering the Crucial Residues involved in Heterodimerization of Bak Peptide and Anti-apoptotic Proteins for Apoptosis. J. Biomol. Struct. Dyn. 1–35. 10.1080/07391102.2017.1331863. - DOI - PubMed
    1. Billard C. (2013) BH3 mimetics: status of the field and new developments. Mol. Cancer Ther. 12, 1691–1700. 10.1158/1535-7163.MCT-13-0058. - DOI - PubMed
    1. Zhuang J.; Brady H. J. (2006) Emerging role of Mcl-1 in actively counteracting BH3-only proteins in apoptosis. Cell Death Differ. 13, 1263–1267. 10.1038/sj.cdd.4401952. - DOI - PubMed
    1. Placzek W. J.; Sturlese M.; Wu B.; Cellitti J. F.; Wei J.; Pellecchia M. (2011) Identification of a novel Mcl-1 protein binding motif. J. Biol. Chem. 286, 39829–39835. 10.1074/jbc.M111.305326. - DOI - PMC - PubMed

Publication types

MeSH terms

LinkOut - more resources