. 2018 Mar;29(3):356-369.
doi: 10.1177/0956797617735534. Epub 2018 Jan 18.

Unifying Visual Space Across the Left and Right Hemifields

Affiliations

Unifying Visual Space Across the Left and Right Hemifields

Zhimin Chen et al. Psychol Sci. 2018 Mar.

Abstract

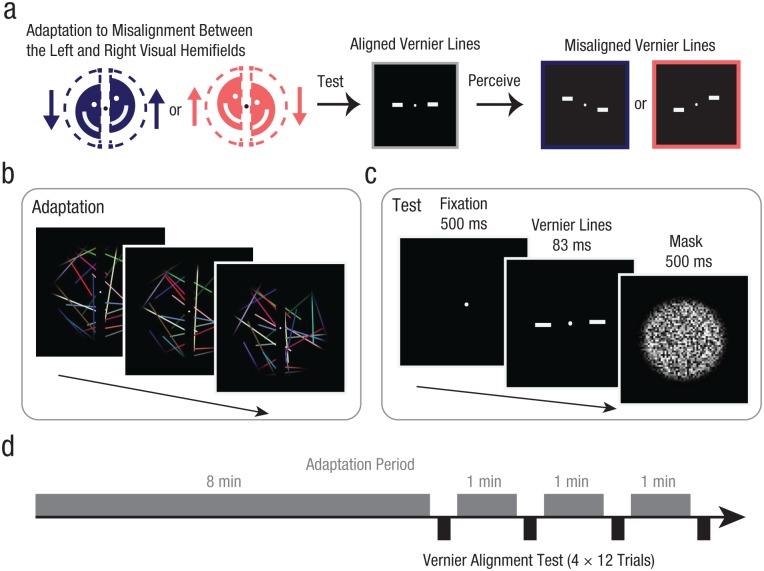
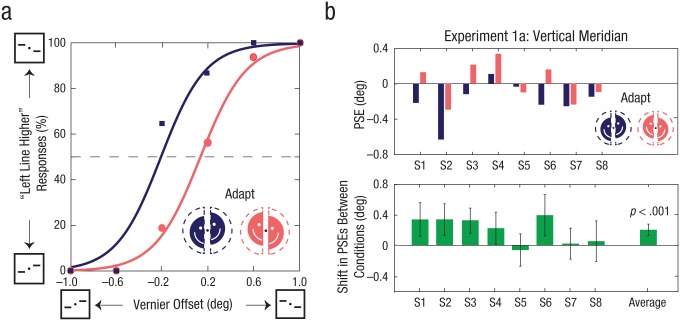
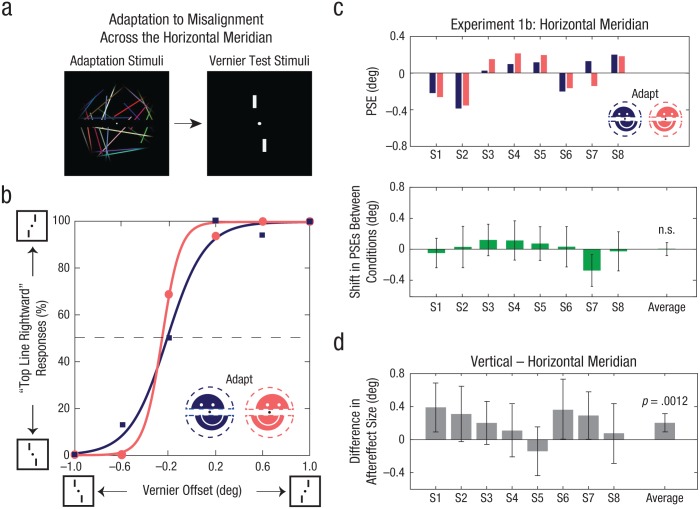
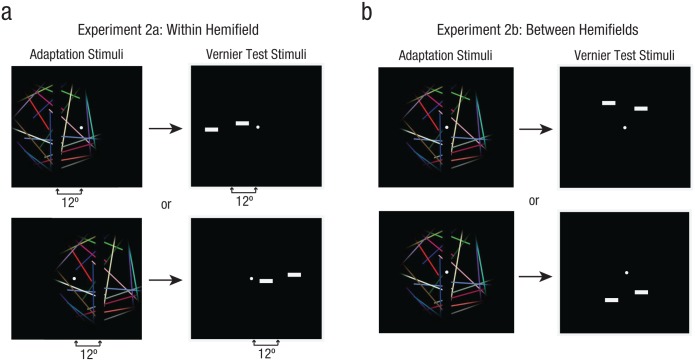
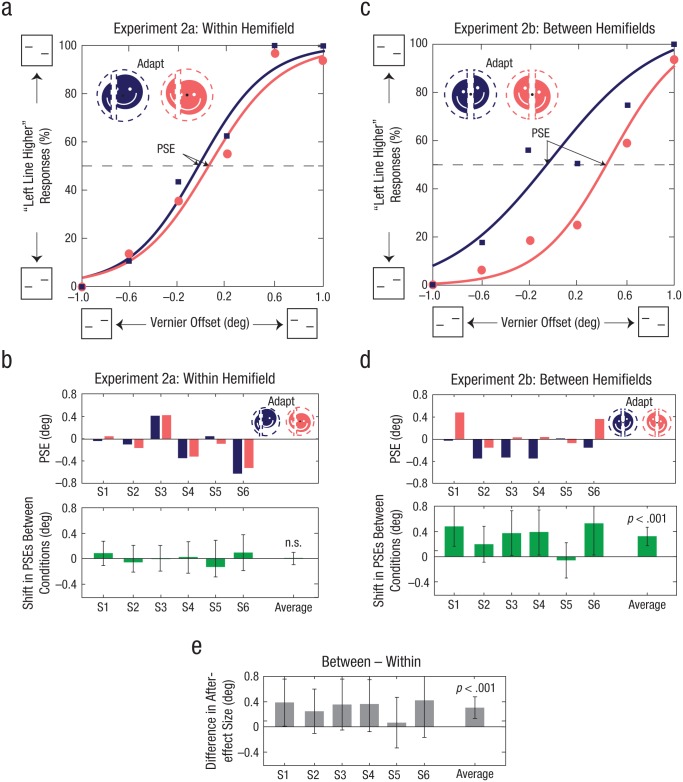
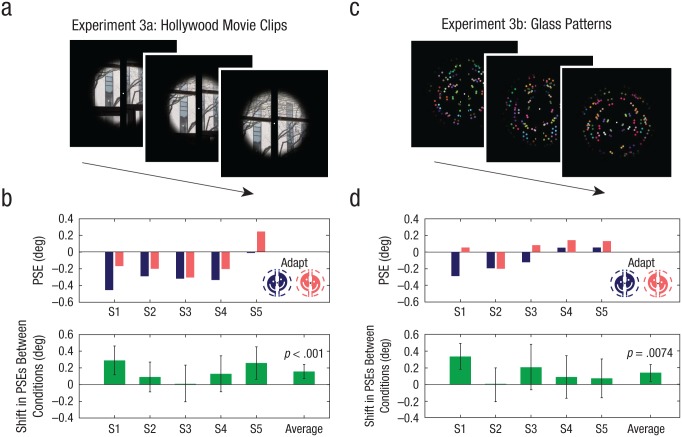
Visual space is perceived as continuous and stable even though visual inputs from the left and right visual fields are initially processed separately within the two cortical hemispheres. In the research reported here, we examined whether the visual system utilizes a dynamic recalibration mechanism to integrate these representations and to maintain alignment across the visual fields. Subjects adapted to randomly oriented moving lines that straddled the vertical meridian; these lines were vertically offset between the left and right hemifields. Subsequent vernier alignment judgments revealed a negative aftereffect: An offset in the same direction as the adaptation was required to correct the perceived misalignment. This aftereffect was specific to adaptation to vertical, but not horizontal, misalignments and also occurred following adaptation to movie clips and patterns without coherent motion. Our results demonstrate that the visual system unifies the left and right halves of visual space by continuously recalibrating the alignment of elements across the visual fields.

Keywords: adaptation; hemifield; open data; open materials; perceptual continuity; psychophysics; visual fields; visual perception.


Conflict of interest statement

Declaration of Conflicting Interests: The author(s) declared that there were no conflicts of interest with respect to the authorship or the publication of this article.

Figures

Fig. 1.
Fig. 1.
Prediction and experimental paradigm for Experiments 1a and 1b. After subjects adapted to a dynamic stimulus that was misaligned between the left and right hemifields (a), we expected aligned vernier stimuli to appear misaligned in a direction opposite from the adapting offset. During the adaptation period (b), we presented a moving set of colored lines that rotated randomly in different directions while subjects performed a demanding central fixation task. The left and right halves of the stimulus were shifted vertically in opposite directions, and a central dark occluder covered apparent line breaks at the midline. During the test period (c), each trial began with a fixation dot, followed by a pair of vernier lines centered on the fixation dot, which straddled the vertical meridian. The vernier lines appeared either horizontally (Experiment 1a; shown here) or vertically (Experiment 1b). To control exposure duration, we presented a noise mask of black and white squares following the vernier stimulus. Subjects reported whether the left line was higher or lower than the right line in a two-alternative forced-choice task. Each session (d) began with an 8-min initial adaptation period, followed by four periods of 12 vernier test trials interspersed with three periods of 1-min top-up adaptation.
Fig. 2.
Fig. 2.
Example psychometric functions and results of Experiment 1a. Example psychometric functions from Subject 1 are illustrated in (a). The percentage of trials in which this subject reported that the left vernier test line was higher than the right line is shown as a function of the degree of offset between vernier test lines, separately for each type of adapting stimulus. The squares and their associated curve represent vernier trials with the left half of the adapting stimulus shifted downward and the right half upward. The dots and their associated curve represent trials with the halves of the adapting stimulus shifted in the opposite directions. The top graph in (b) shows the point of subjective equality (PSE) from psychometric function fits for the two adaptation conditions, separately for each of the 8 subjects. PSEs were defined as the vernier offset at which the fitted functions intersected 50% left/right reported offsets. The lower graph shows the average difference in PSEs between the two adaptation conditions for each subject and for the entire group. Error bars indicate bootstrapped 95% confidence intervals, and the p value is based on the group-permuted null distribution.
Fig. 3.
Fig. 3.
Stimulus configuration, example psychometric functions, and results of Experiment 1b. On each trial (a), adaptation to misaligned upper and lower hemifields was followed by vernier targets straddling the fixation dot across the horizontal meridian. Example psychometric functions from Subject 1 are illustrated in (b). The percentage of trials in which this subject reported that the top vernier test line was farther to the right than the bottom line is shown as a function of the degree of offset between vernier test lines, separately for each type of adapting stimulus. The squares and their associated curve represent vernier trials with the top half of the adapting stimulus shifted to the left and the bottom half to the right. The dots and their associated curve represent trials with the halves of the adapting stimulus shifted in the opposite directions. The top graph in (c) shows the point of subjective equality (PSE) from psychometric function fits for the two adaptation conditions, separately for each of the 8 subjects. PSEs were defined as the vernier offset at which the fitted functions intersected 50% top/bottom reported offsets. The lower graph shows the average difference in PSEs between the two adaptation conditions for each individual subject and for the entire group. The average difference in aftereffect size between the vertical and horizontal meridians (d) is shown for each subject and for the entire group. Error bars in (c) and (d) indicate bootstrapped 95% confidence intervals, and the p value is based on the group-permuted null distribution.
Fig. 4.
Fig. 4.
Stimulus configuration in Experiments 2a and 2b. In each trial of Experiment 2a (a), subjects viewed an adapting stimulus that was split and misaligned either to the left or to the right of central fixation within the same hemifield. This was followed by vernier targets flashed in either the left or the right visual field. In each trial of Experiment 2b (b), adaptation to a vertical misalignment between the hemifields was followed by vernier targets flashed at a peripheral location either above or below fixation.
Fig. 5.
Fig. 5.
Example psychometric functions and results of Experiments 2a and 2b. Example psychometric functions are shown for Subject 1 in (a) Experiment 2a and (c) Experiment 2b. The percentage of trials in which this subject reported that the left vernier test line was higher than the right line is shown as a function of the degree of offset between vernier test lines, separately for each type of adapting stimulus. The squares and their associated curve represent vernier trials with the left half of the adapting stimulus shifted downward and the right half upward. The dots and their associated curve represent trials with the halves of the adapting stimulus shifted in the opposite directions. The top graphs in (b) and (d) show the point of subjective equality (PSE) from psychometric function fits for the two adaptation conditions, separately for each of the 6 subjects in each experiment. PSEs were defined as the vernier offset at which the fitted functions intersected 50% left/right reported offsets. The lower graphs in (b) and (d) show the average difference in PSEs between the two adaptation conditions for each subject and for the entire group. The difference in aftereffect size between Experiments 2a and 2b (e) was calculated by subtracting the values shown in the lower graphs in (b) from the values shown in the lower graphs in (d). Error bars in the bar graphs indicate bootstrapped 95% confidence intervals, and p values are based on the group-permuted null distribution.
Fig. 6.
Fig. 6.
Adapting stimuli and results of Experiments 3a and 3b. The adapting stimulus in Experiment 3a (a) consisted of movie clips from The Dark Knight (2008), and the adapting stimulus in Experiment 3b (c) consisted of sequences of static Glass patterns. (For illustrative purposes, the stills shown here for Experiment 3a are taken from personal photographs.) The top graphs in (b) and (d) show the points of subjective equality (PSE) from psychometric function fits for the two adaptation conditions, separately for each of the 5 subjects in each experiment. PSEs were defined as the vernier offset at which the fitted functions intersected 50% top/bottom reported offsets. The lower graphs in (b) and (d) show the average difference in PSEs between the two adaptation conditions for each subject and for the entire group. Error bars indicate bootstrapped 95% confidence intervals, and p values are based on the group-permuted null distribution.

Similar articles

Cited by

References

    1. Ahumada A. J., Mulligan J. B. (1990). Learning receptor positions from imperfectly known motions. In Rogowitz B. E., Allebach J. P. (Eds.), Proceedings Volume 1249, Human vision and electronic imaging: Models, methods, and applications (pp. 124–134). Bellingham, WA: SPIE. doi:10.1117/12.19665 - DOI
    1. Blakemore C. (1969). Binocular depth discrimination and the nasotemporal division. The Journal of Physiology, 205, 471–497. doi:10.1113/jphysiol.1969.sp008978 - DOI - PMC - PubMed
    1. Brainard D. H. (1997). The Psychophysics Toolbox. Spatial Vision, 10, 433–436. - PubMed
    1. Bridgeman B., Peery S., Anand S. (1997). Interaction of cognitive and sensorimotor maps of visual space. Perception & Psychophysics, 59, 456–469. doi:10.3758/BF03211912 - DOI - PubMed
    1. Efron B., Tibshirani R. J. (1993). An introduction to the bootstrap. London, England: Chapman & Hall.

Publication types