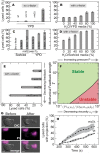
Mechanical feedback coordinates cell wall expansion and assembly in yeast mating morphogenesis
- PMID: 29346368
- PMCID: PMC5790295
- DOI: 10.1371/journal.pcbi.1005940
Mechanical feedback coordinates cell wall expansion and assembly in yeast mating morphogenesis
Abstract
The shaping of individual cells requires a tight coordination of cell mechanics and growth. However, it is unclear how information about the mechanical state of the wall is relayed to the molecular processes building it, thereby enabling the coordination of cell wall expansion and assembly during morphogenesis. Combining theoretical and experimental approaches, we show that a mechanical feedback coordinating cell wall assembly and expansion is essential to sustain mating projection growth in budding yeast (Saccharomyces cerevisiae). Our theoretical results indicate that the mechanical feedback provided by the Cell Wall Integrity pathway, with cell wall stress sensors Wsc1 and Mid2 increasingly activating membrane-localized cell wall synthases Fks1/2 upon faster cell wall expansion, stabilizes mating projection growth without affecting cell shape. Experimental perturbation of the osmotic pressure and cell wall mechanics, as well as compromising the mechanical feedback through genetic deletion of the stress sensors, leads to cellular phenotypes that support the theoretical predictions. Our results indicate that while the existence of mechanical feedback is essential to stabilize mating projection growth, the shape and size of the cell are insensitive to the feedback.
Conflict of interest statement
The authors have declared that no competing interests exist.
Figures


Similar articles
-
Coordinating cell polarization and morphogenesis through mechanical feedback.PLoS Comput Biol. 2021 Jan 28;17(1):e1007971. doi: 10.1371/journal.pcbi.1007971. eCollection 2021 Jan. PLoS Comput Biol. 2021. PMID: 33507956 Free PMC article.
-
Together we are strong--cell wall integrity sensors in yeasts.Yeast. 2010 Aug;27(8):531-40. doi: 10.1002/yea.1785. Yeast. 2010. PMID: 20641024 Review.
-
A block of endocytosis of the yeast cell wall integrity sensors Wsc1 and Wsc2 results in reduced fitness in vivo.Mol Genet Genomics. 2010 Sep;284(3):217-29. doi: 10.1007/s00438-010-0563-2. Epub 2010 Jul 22. Mol Genet Genomics. 2010. PMID: 20652590
-
Yeast endocytic adaptor AP-2 binds the stress sensor Mid2 and functions in polarized cell responses.Traffic. 2014 May;15(5):546-57. doi: 10.1111/tra.12155. Epub 2014 Feb 25. Traffic. 2014. PMID: 24460703 Free PMC article.
-
How do I begin? Sensing extracellular stress to maintain yeast cell wall integrity.Eur J Cell Biol. 2011 Sep;90(9):740-4. doi: 10.1016/j.ejcb.2011.04.006. Epub 2011 Jun 2. Eur J Cell Biol. 2011. PMID: 21640429 Review.
Cited by
-
Analytical Models for Measuring the Mechanical Properties of Yeast.Cells. 2023 Jul 27;12(15):1946. doi: 10.3390/cells12151946. Cells. 2023. PMID: 37566025 Free PMC article. Review.
-
Role of combined cell membrane and wall mechanical properties regulated by polarity signals in cell budding.Phys Biol. 2020 Oct 21;17(6):065011. doi: 10.1088/1478-3975/abb208. Phys Biol. 2020. PMID: 33085651 Free PMC article.
-
Study of impacts of two types of cellular aging on the yeast bud morphogenesis.PLoS Comput Biol. 2024 Sep 30;20(9):e1012491. doi: 10.1371/journal.pcbi.1012491. eCollection 2024 Sep. PLoS Comput Biol. 2024. PMID: 39348424 Free PMC article.
-
Conserved physical mechanisms of cell and tissue elongation.Development. 2024 May 15;151(10):dev202687. doi: 10.1242/dev.202687. Epub 2024 May 20. Development. 2024. PMID: 38767601 Free PMC article. Review.
-
Coordinating cell polarization and morphogenesis through mechanical feedback.PLoS Comput Biol. 2021 Jan 28;17(1):e1007971. doi: 10.1371/journal.pcbi.1007971. eCollection 2021 Jan. PLoS Comput Biol. 2021. PMID: 33507956 Free PMC article.
References
-
- Engler A, Humbert P, Wehrle-Haller B, Weaver V. Multiscale modeling of form and function. Science. 2009;324(5924):208–212. doi: 10.1126/science.1170107 - DOI - PMC - PubMed
-
- Young K. The selective value of bacterial shape. Microbiology and molecular biology reviews: MMBR. 2006;70(3):660–703. doi: 10.1128/MMBR.00001-06 - DOI - PMC - PubMed
-
- Nelson W. Adaptation of core mechanisms to generate cell polarity. Nature. 2003;422(6933):766–774. doi: 10.1038/nature01602 - DOI - PMC - PubMed
-
- Cabib E, Arroyo J. How carbohydrates sculpt cells: chemical control of morphogenesis in the yeast cell wall. Nature Reviews Microbiology. 2013;11(9):648–655. doi: 10.1038/nrmicro3090 - DOI - PubMed
-
- Geitmann A, Ortega J. Mechanics and modeling of plant cell growth. Trends in plant science. 2009;14(9):467–478. doi: 10.1016/j.tplants.2009.07.006 - DOI - PubMed
Publication types
MeSH terms
Substances
Grants and funding
LinkOut - more resources
Full Text Sources
Other Literature Sources
Molecular Biology Databases

