. 2018 Mar 1;77(3):229-245.
doi: 10.1093/jnen/nlx119.

LC3 Immunostaining in the Inferior Olivary Nuclei of Cats With Niemann-Pick Disease Type C1 Is Associated With Patterned Purkinje Cell Loss

Affiliations

LC3 Immunostaining in the Inferior Olivary Nuclei of Cats With Niemann-Pick Disease Type C1 Is Associated With Patterned Purkinje Cell Loss

Brittney L Gurda et al. J Neuropathol Exp Neurol. .

Abstract

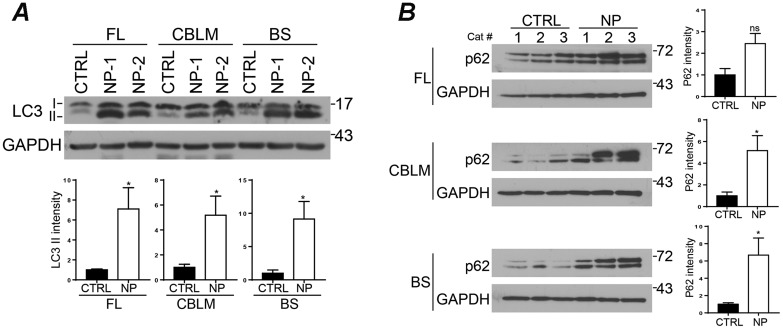
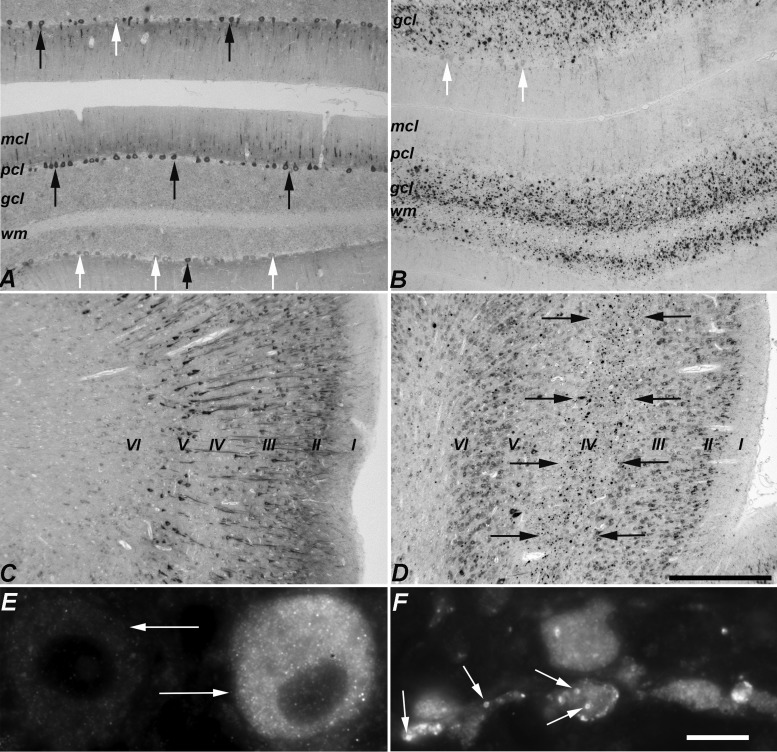
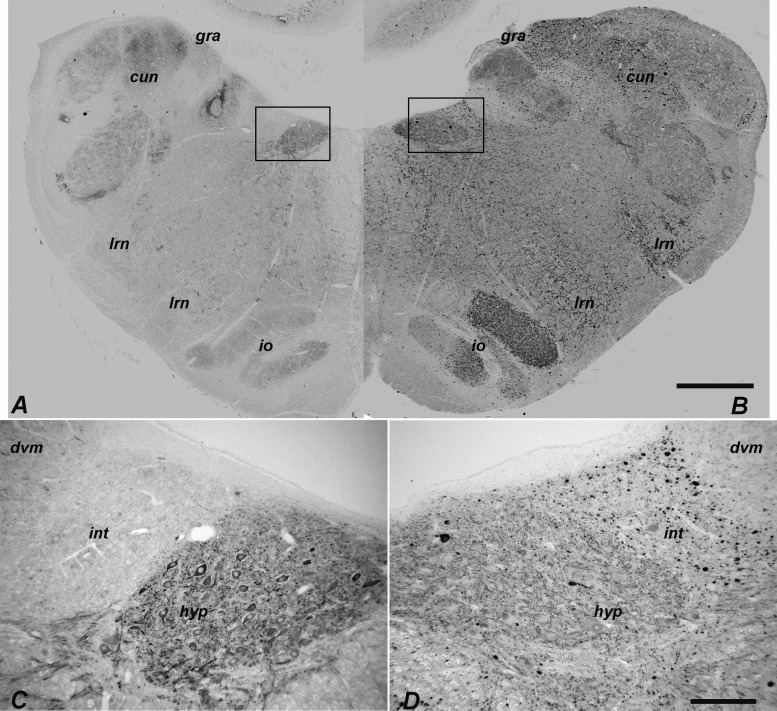
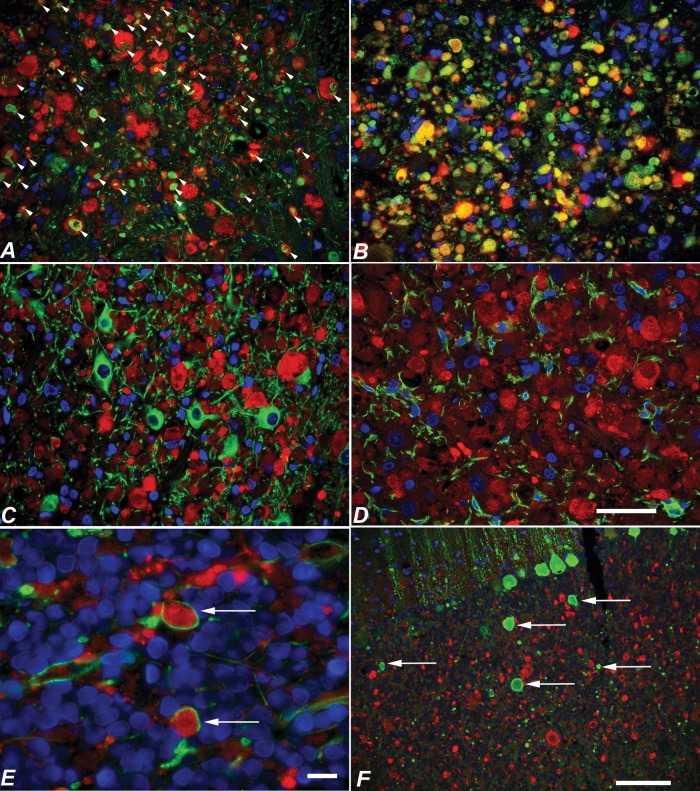
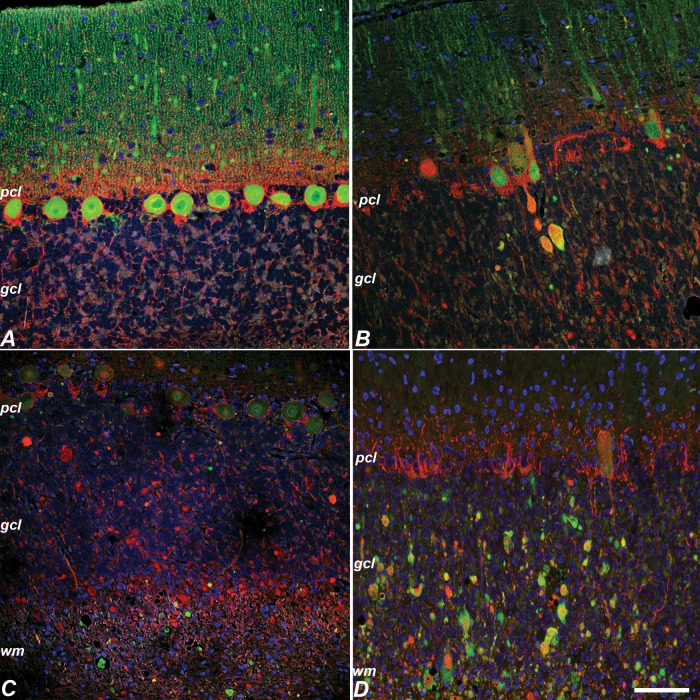
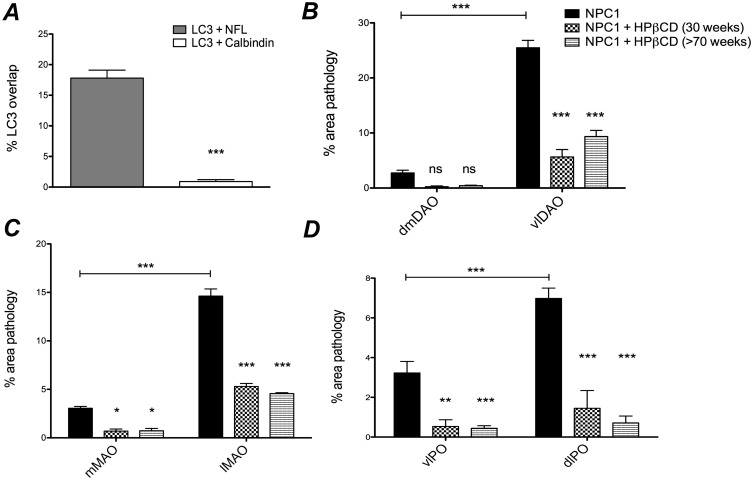
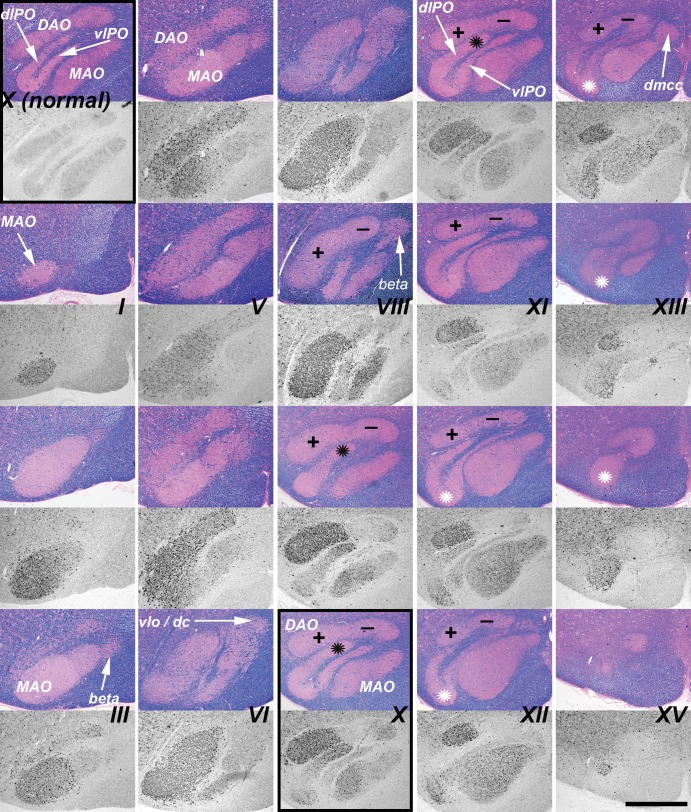
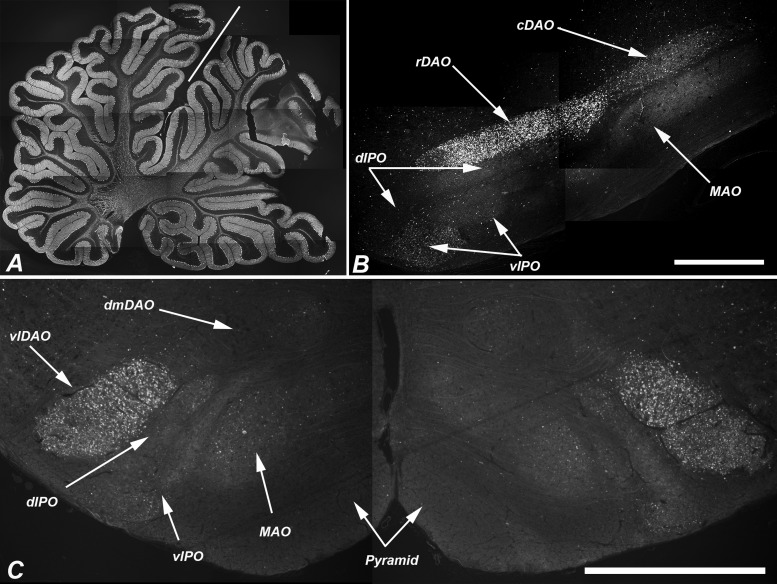
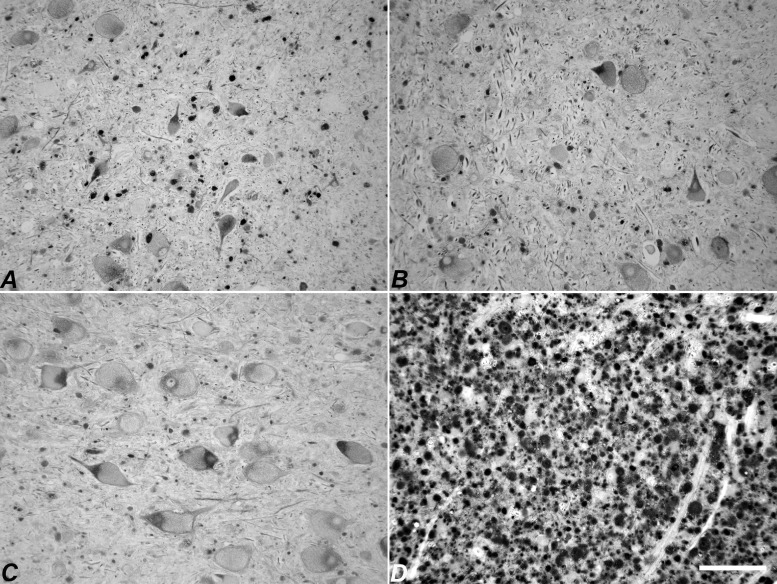
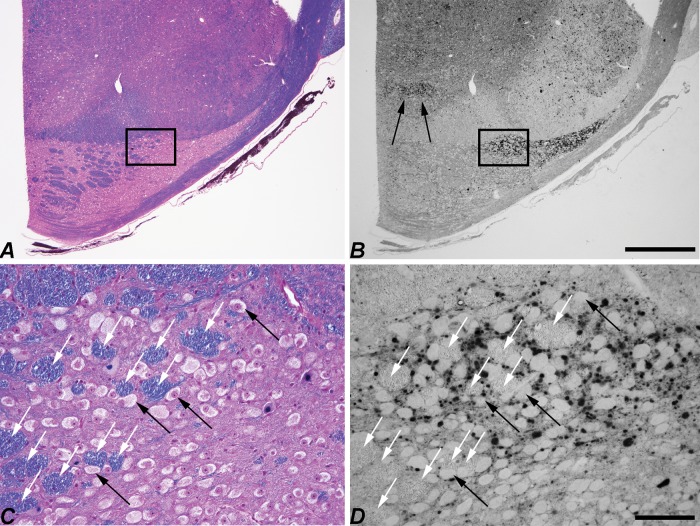
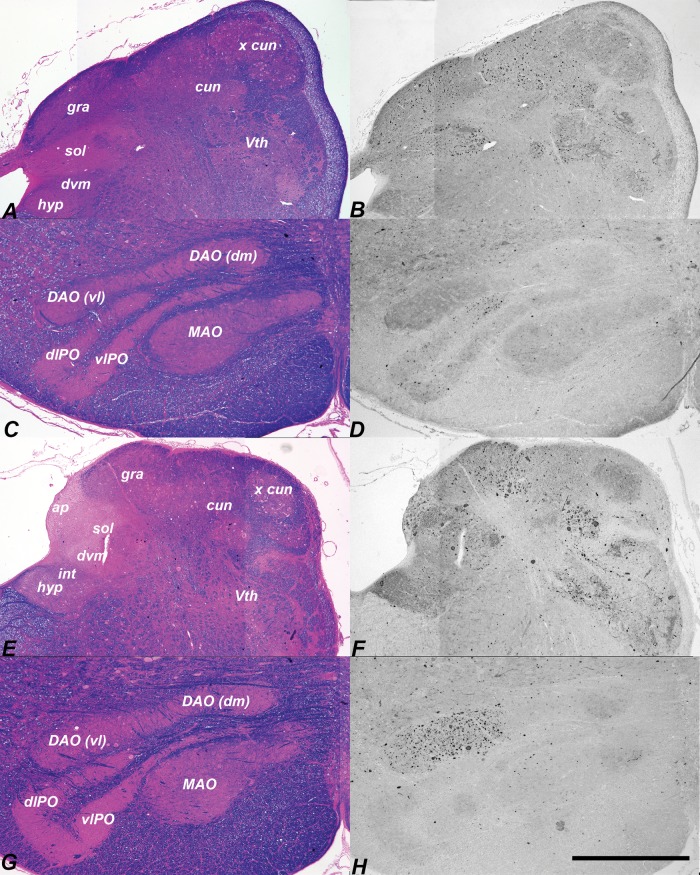
The feline model of Niemann-Pick disease, type C1 (NPC1) recapitulates the clinical, neuropathological, and biochemical abnormalities present in children with NPC1. The hallmarks of disease are the lysosomal storage of unesterified cholesterol and multiple sphingolipids in neurons, and the spatial and temporal distribution of Purkinje cell death. In feline NPC1 brain, microtubule-associated protein 1 light chain 3 (LC3) accumulations, indicating autophagosomes, were found within axons and presynaptic terminals. High densities of accumulated LC3 were seen in subdivisions of the inferior olive, which project to cerebellar regions that show the most Purkinje cell loss, suggesting that autophagic abnormalities in specific climbing fibers may contribute to the spatial pattern of Purkinje cell loss seen. Biweekly intrathecal administration of 2-hydroxypropyl-beta cyclodextrin (HPβCD) ameliorated neurological dysfunction, reduced cholesterol and sphingolipid accumulation, and increased lifespan in NPC1 cats. LC3 pathology was reduced in treated animals suggesting that HPβCD administration also ameliorates autophagic abnormalities. This study is the first to (i) identify specific brain regions exhibiting autophagic abnormalities in any species with NPC1, (ii) provide evidence of differential vulnerability among discrete brain nuclei and pathways, and (iii) show the amelioration of these abnormalities in NPC1 cats treated with HPβCD.

Keywords: Autophagy; Axonal degeneration; Cerebellar degeneration; LC3; Lysosomal storage disease; Neurodegeneration; Neuronal pathway.


Figures

FIGURE 1.
FIGURE 1.
LC3 and p62 protein levels in NPC1 cat brains. (A, B) Total lysates from frontal lobe (FL), cerebellum (CBLM), and brainstem (BS) from normal control (CTRL 1–3) and NPC1 (NP 1–3) cats. In contrast to control cats, NPC1 cats have a significant increase in LC3-II in all brain regions (A) and p62 in the cerebellum and brainstem (B). Quantitative data are ±SE. Student t-test (A) n = 4 (CTRL), 5 (NPC), (B) n = 3. n.s., not significant, *p ≤ 0.05.
FIGURE 2.
FIGURE 2.
Comparison of LC3 immunohistochemistry between normal control and NPC1 cat cerebellar and cerebral cortices. (A) Control cerebellar cortex: diffuse cytoplasmic staining was seen in some Purkinje cell perikarya and proximal dendrites (black arrows) but others were unstained (white arrows). (B) NPC1 cerebellar cortex: aggregates were seen in the granular cell layer and in the white matter. A few surviving Purkinje cells were detected but perikarya did not stain for LC3 (white arrows). Little LC3-indicated pathology was seen in the molecular cell layer. (A) and (B) images were taken of the anterior vermis. (C) Control cerebral cortex: heterogeneity was seen with more heavily-labeled neurons in layers II, III, and V. (D) NPC1 cerebral cortex. In the anterior lateral gyrus, labeled aggregates were found in the internal granular layer (IV) indicated by the black arrows. (E) Two adjacent Purkinje cells (arrows) in control cerebellum showing differential LC3 immunostaining. The diffuse, fine granular staining found in control brain is seen in the cell on the right. (F) In NPC1, small annular structures staining for LC3 are readily found in pathologic accumulations in the cerebellar granular cell layer (arrows). mcl, molecular cell layer; pcl, Purkinje cell layer; gcl, granular cell layer; wm, white matter. Scale bars: (A–D) 500 µm; (E, F) 10 µm.
FIGURE 3.
FIGURE 3.
Comparison of LC3 immunohistochemistry between normal control and NPC1 cat brainstem. (A, B) Low-magnification image of control medulla (A) juxtaposed with that of NPC1 medulla (B) at approximately the same rostro-caudal level. The generally pale, diffuse labeling in control stands in sharp contrast to the darkly labeled puncta and aggregates seen in NPC1 cats. (C, D) Differential labeling of individual neuronal perikarya and distinct neuronal nuclei was seen in control brain (shown in C, a higher magnification image of the boxed area in A). LC3-indicated pathology was also variable among neuronal nuclei; some appeared unaffected while others were mildly to severely impacted. An example of this is demonstrated between the nucleus intercalatus and the hypoglossal or dorsal vagal motor nucleus in NPC1 brain (D, a higher magnification image of the boxed area in B). gra, gracile nucleus; cun, cuneate nucleus; lrn, lateral reticular nucleus; io, inferior olive, dvm, dorsal vagal motor nucleus; int, nucleus intercalatus; hyp, hypoglossal nucleus. Scale bars: (A, B) 1 mm; (C, D) 200 µm.
FIGURE 4.
FIGURE 4.
Costaining of LC3 with neurofilament, α-synuclein, MAP2, Iba1, MBP, and calbindin in NPC1 cat brain. (A–F) LC3 (red in all images) colocalized with axonal and presynaptic markers neurofilament (arrowheads in A) and α-synuclein (yellow in B), but did not colocalize with MAP2-positive neuronal perikayra or dendrites (C) or glial marker Iba1 (D). LC3 accumulations were seen bounded by MBP (arrows in E). Calbindin-labeled axonal spheroids in the cerebellum (arrows) did not colabel for LC3 (F). Scale bars: (A–D), 50 µm; (E) 10 µm; (F) 100 µm.
FIGURE 5.
FIGURE 5.
Neurofilament labeling in normal control and NPC1 cat cerebellar cortex. (A) Neurofilament (red in all panels) was not detected in control Purkinje cells (calbindin, green). (B) In NPC1, rare neurofilament and calbindin colabeling was seen in Purkinje axon swellings (calbindin, green). (C, D) However, most axonal swellings were neurofilament-positive and calbindin-negative (calbindin, green) (C). The great majority of neurofilament positive swellings colabeled with LC3 (LC3, green) (D). pcl, Purkinje cell layer; gcl, granular cell layer; wm, cerebellar white matter. Scale bar: 100 µm.
FIGURE 6.
FIGURE 6.
Quantification of LC3 colocalization with neurofilament versus calbindin in NPC1 cerebellar axonal spheroids, and quantification of LC3 pathology in the inferior olive at Brodal level X of untreated NPC1 and HPβCD-treated NPC1 cats. (A) The incidence of LC3 colocalization with either calbindin or with neurofilament was measured from pairs of images representing identical microscopic fields from the anterior cerebellum of NPC1 cats (n = 4). Significantly more colocalization with neurofilament was seen (p < 0.001). (B) The area occupied by aberrant LC3 staining in untreated NPC1 (n = 3), HPβCD-treated 30-week-old NPC1 (n = 3) and HPβCD-treated >70-week-old NPC1 (n = 3) cats was measured and then calculated as a percent of the total area within each olivary subdivision. In the dorsal accessory olive, significantly (p < 0.001) more pathology was seen in the ventrolateral region (vlDAO) compared with the dorsomedial region (dmDAO) of untreated NPC1 cats (horizontal bar). Both groups of treated cats showed a significant diminution of pathology compared with untreated NPC1 in the vlDAO (p < 0.001). The percent of pathology in the dmDAO was not significantly different between treated and untreated NPC1 cats. (C) In the medial accessory olive, significantly more pathology was seen in the lateral (lMAO) compared with the medial (mMAO) region of untreated NPC1 cats (horizontal bar) (p < 0.001). There was a significant diminution of pathology in the lMAO (p < 0.001) and the mMAO (p < 0.05) in both treatment groups compared with untreated NPC1 cats. D: In the principal olive, significantly (p < 0.001) more pathology was seen in the dorsal lamina (dlPO) compared with the ventral lamina of the principal olive (vlPO) of untreated NPC1 cats (horizontal bar). Significantly diminished pathology in the dlPO (p < 0.001) and vlPO (p < 0.01) was seen in both treatment groups. Data are (A) SE, Student t-test; (B–D) SE, 2-way ANOVA. *p < 0.05, **p < 0.01, ***p < 0.001, ns, not significant.
FIGURE 7.
FIGURE 7.
LC3 pathology was found in specific subregions of the inferior olive of the NPC1 cat throughout its caudal-to-rostral extent. This figure is composed of a series of paired iron-Eriochrom cyanine R (EcyR)/eosin (reference in which the entire inferior olive is stained pink), and monochomatic LC3 immunohistochemistry (IHC) images of adjacent tissue sections that are arranged in 5 vertical columns. The series begins caudally at Brodal level I (Supplementary Data Fig. S3) in the first column and continues down the column to level III. The series resumes at the top of column 2, continues down the column to level VI, etc. The series ends rostrally at level XV at the bottom of column 5. The midline of the brain is at the right and ventral at the bottom in all images. Aberrant LC3 accumulation is indicated by the dark punctate IHC staining and is seen throughout most of the MAO. Densely concentrated LC3 pathology in the ventrolateral portion of the DAO is distinguished from the largely unaffected dorsomedial portion by plus and minus symbols on the corresponding reference images. LC3 pathology also localized to both the most medial portion of the dlPO and to the junction region between the vlPO and dlPO indicated by black and white asterisks respectively. The top panel in column 1 (boxed) is from a normal control cat for comparison to an equivalent location in the NPC1 cat at the bottom panel of column 3 (boxed). DAO, dorsal accessory olive; MAO, medial accessory olive; vlPO, principal olive, ventral lamina; dlPO, principal olive, dorsal lamina; vlo/dc, ventral lateral outgrowth/dorsal cap; dmcc, dorsal medial cell column. Scale bar: 1 mm.
FIGURE 8.
FIGURE 8.
LC3-indicated pathology in the dorsal accessory olive preceded obvious loss of Purkinje cells. (A) Low-power composite image of a parasagittal section of the cerebellum of an 11-week-old NPC1 cat stained for calbindin showing no evidence of Purkinje cell loss. (B) Sagittal section through the inferior olive of the same cat. Pathologic LC3 immunoreactivity is seen in the rDAO. Other regions of the olive show little pathology at this age. (Note the very lightly concentrated pathology in vlPO and cDAO). (C) Transverse section at Brodal level X of a second cat (12-week-old) shows bilateral concentration of LC3 pathology in the vlDAO but little in other olivary subregions. The line in (A) indicates the primary fissure with the anterior vermis (lobules I–V) to the left. rDAO, rostral dorsal accessory olive; cDAO, caudal dorsal accessory olive; vlDAO, ventrolateral DAO; dmDAO, dorsomedial DAO; vlPO, ventral lamina of the principal olive; dlPO, dorsal lamina of the principal olive; MAO, medial accessory olive. Scale bars: (B, C) = 1 mm.
FIGURE 9.
FIGURE 9.
LC3 pathology in NPC1 cats was minimal in the deep cerebellar nuclei, which are the exclusive Purkinje cell efferent populations. Fastigial nucleus (A), interpositus nucleus (B), and dentate nucleus (C) are shown. For comparison, the severe pathology seen in the ventrolateral part of the dorsal accessory olive is shown in (D). Scale bar: 100 µm.
FIGURE 10.
FIGURE 10.
LC3 pathology is sharply defined in the dorsolateral pontine nucleus of NPC1 cats. Low-magnification images of adjacent transverse sections of the pons stained with EcyR and eosin (A) and anti-LC3 (B). Boxed areas are shown at higher magnification in (C, D). Note that LC3 accumulations lie within the synaptic neuropil and are not seen in neuronal perikarya (black arrows [C, D]). Transversely-sectioned axon bundles are also largely free of pathology (white arrows [C, D]). The tegmental pontine reticular nucleus is another brainstem nucleus where concentrated LC3 pathology was found and is indicated by the arrows in panel (B). Scale bars: (A, B) 1 mm; (C, D) 100 µm.
FIGURE 11.
FIGURE 11.
Bi-weekly intracisternal HPβCD injections begun at 3 weeks ameliorates LC3-indictaed pathology in the brainstem. EcyR and eosin reference slides left and adjacent LC3-IHC sections right. Dorsal caudal medulla of an HPβCD-treated NPC1 cat killed at 31 weeks (A, B) showed scattered pathology in the gracile, cuneate, and solitary nuclei. Almost no LC3 aggregates were found in the inferior olive of this specimen (C, D). Moderate pathology was seen in the gracile, cuneate (E, F) and ventrolateral portion of the dorsal accessory olive (G, H) in a 137-week-old treated cat. hyp, hypoglossal; int, nucleus intercalatus; dvm, dorsal vagal motor nucleus; ap, area postrema; sol, solitary nucleus; gra, gracile nucleus; cun, main cuneate nucleus; x cun, external cuneate nucleus; Vth, spinal trigeminal nucleus; DAO(vl), ventrolateral dorsal accessory olive; DAO(dm), dorsomedial dorsal accessory olive; MAO, medial accessory olive; dlPO, principal olive dorsal lamina; vlPO, principal olive ventral lamina. Scale bar: 1 mm.

References

    1. Pentchev PG, Comly ME, Kruth HS, et al. A defect in cholesterol esterification in NiemannPick disease (type C) patients. Proc Natl Acad Sci USA 1985;82:8247–51http://dx.doi.org/10.1073/pnas.82.23.8247 - DOI - PMC - PubMed
    1. Vanier MT, Millat G.. NiemannPick disease type C. Clin Genet 2003;64:269–81http://dx.doi.org/10.1034/j.1399-0004.2003.00147.x - DOI - PubMed
    1. Runz H, Dolle D, Schlitter AM, et al. NPC-db, a NiemannPick type C disease gene variation database. Hum Mutat 2008;29:345–50http://dx.doi.org/10.1002/humu.20636 - DOI - PubMed
    1. Li H, Repa JJ, Valasek MA, et al. Molecular, anatomical, and biochemical events associated with neurodegeneration in mice with NiemannPick type C disease. J Neuropathol Exp Neurol 2005;64:323–33http://dx.doi.org/10.1093/jnen/64.4.323 - DOI - PubMed
    1. Infante RE, Wang ML, Radhakrishnan A, et al. NPC2 facilitates bidirectional transfer of cholesterol between NPC1 and lipid bilayers, a step in cholesterol egress from lysosomes. Proc Natl Acad Sci Usa U S A 2008;105:15287–92 - PMC - PubMed

Publication types

MeSH terms

Substances