. 2018 Apr 1;35(4):792-806.
doi: 10.1093/molbev/msy004.

The Evolutionary History of Nebraska Deer Mice: Local Adaptation in the Face of Strong Gene Flow

Affiliations

The Evolutionary History of Nebraska Deer Mice: Local Adaptation in the Face of Strong Gene Flow

Susanne P Pfeifer et al. Mol Biol Evol. .

Erratum in

Abstract

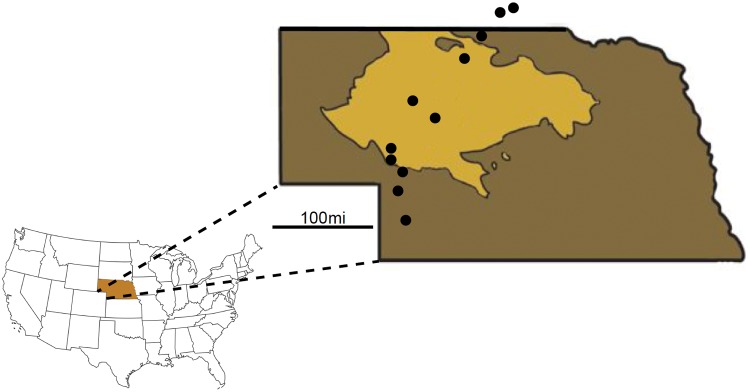
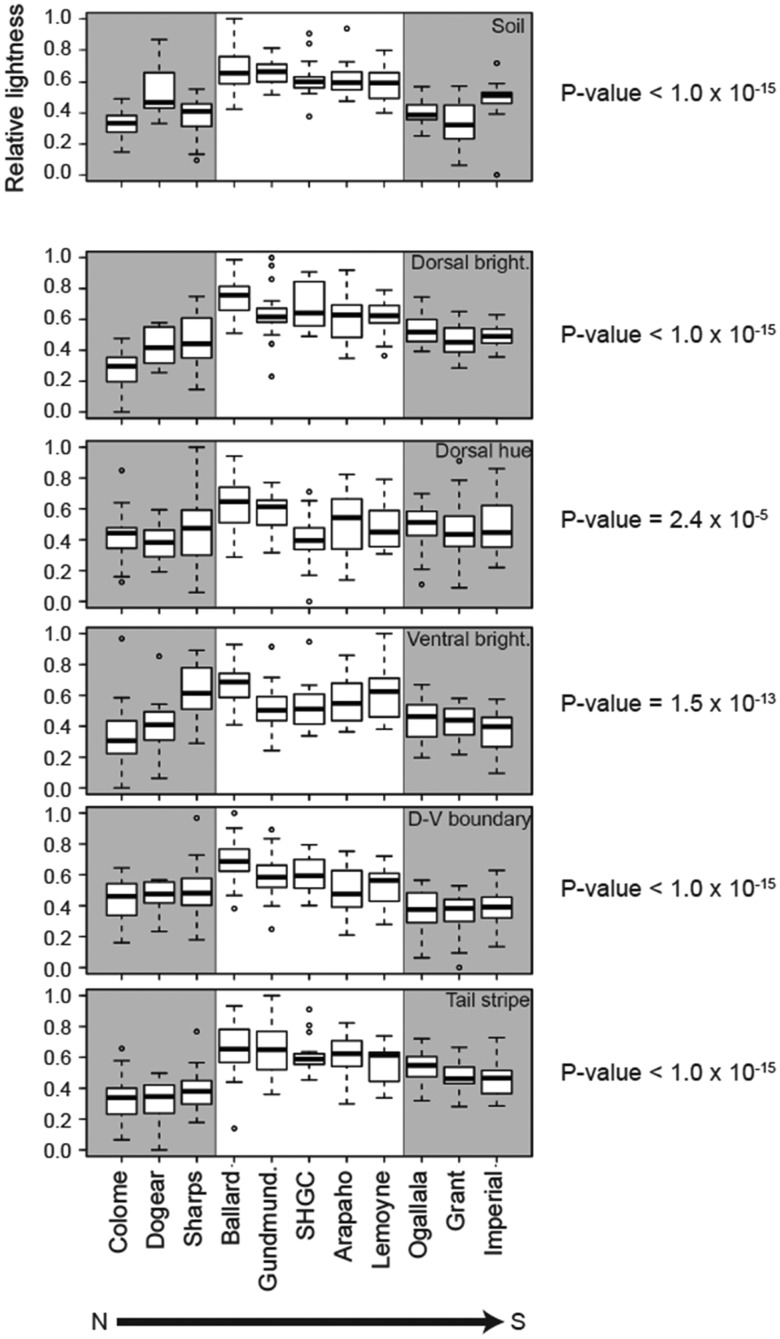
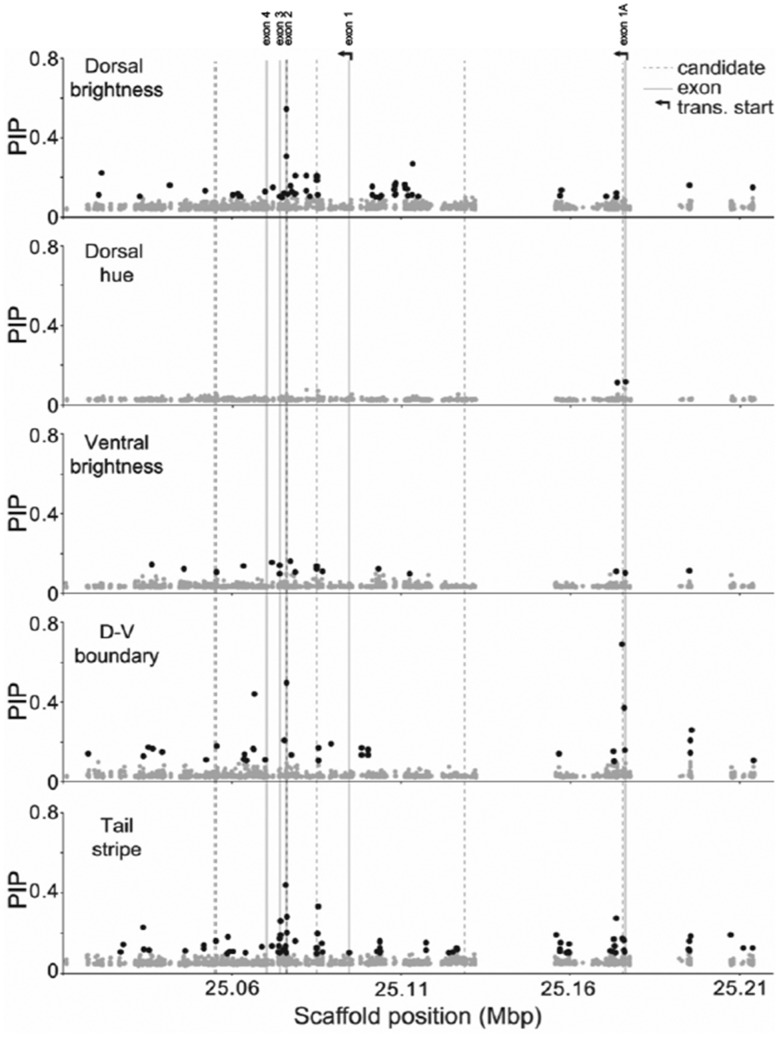
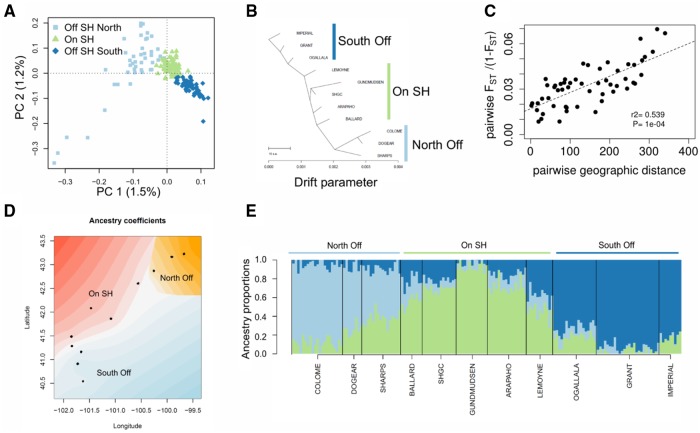
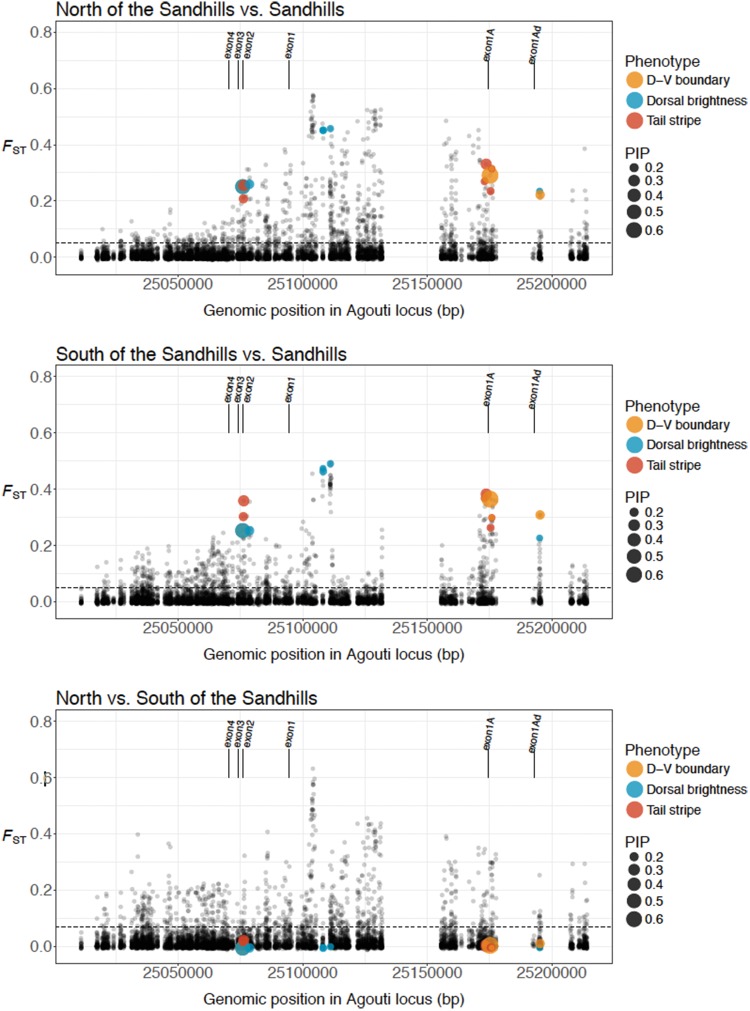
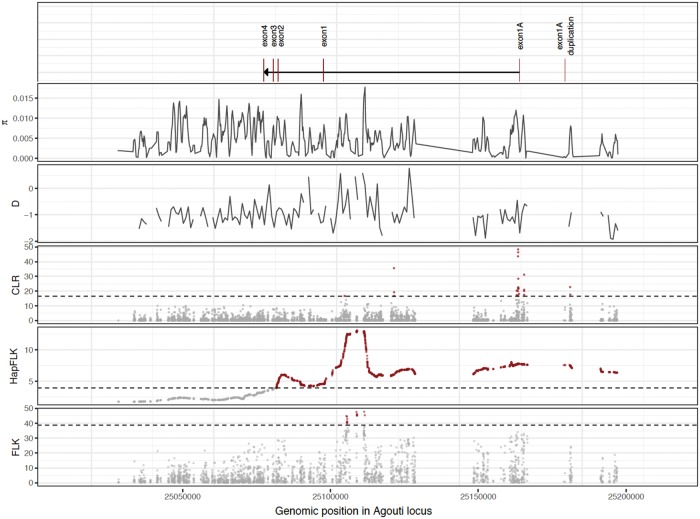
The interplay of gene flow, genetic drift, and local selective pressure is a dynamic process that has been well studied from a theoretical perspective over the last century. Wright and Haldane laid the foundation for expectations under an island-continent model, demonstrating that an island-specific beneficial allele may be maintained locally if the selection coefficient is larger than the rate of migration of the ancestral allele from the continent. Subsequent extensions of this model have provided considerably more insight. Yet, connecting theoretical results with empirical data has proven challenging, owing to a lack of information on the relationship between genotype, phenotype, and fitness. Here, we examine the demographic and selective history of deer mice in and around the Nebraska Sand Hills, a system in which variation at the Agouti locus affects cryptic coloration that in turn affects the survival of mice in their local habitat. We first genotyped 250 individuals from 11 sites along a transect spanning the Sand Hills at 660,000 single nucleotide polymorphisms across the genome. Using these genomic data, we found that deer mice first colonized the Sand Hills following the last glacial period. Subsequent high rates of gene flow have served to homogenize the majority of the genome between populations on and off the Sand Hills, with the exception of the Agouti pigmentation locus. Furthermore, mutations at this locus are strongly associated with the pigment traits that are strongly correlated with local soil coloration and thus responsible for cryptic coloration.


Figures

<sc>Fig</sc>. 1.
Fig. 1.
Sampling locations on (light brown) and off (dark brown, and out of state) of the Nebraska Sand Hills. Sampling spanned a 330-km transect beginning ∼120 km south of the Sand Hills and ending ∼120 km north of the Sand Hills.
<sc>Fig</sc>. 2.
Fig. 2.
Soil color and mouse color traits are lighter on the Nebraska Sand Hills. Box plots for each sampling site were produced using scaled (range: 0–1), normal-quantile transformed values for: soil brightness (B2), dorsal brightness (PC1), dorsal hue (PC2), ventral brightness (PC3), dorsal–ventral (D-V) boundary, and tail stripe. Soil is shown on the separated top panel, and the five pigment traits are given below. In all plots, higher values correspond to lighter/brighter color (y-axis). Gray shading indicates off the Sand Hills sites. Soil and five mouse color traits were significantly lighter on the Sand Hills (dorsal brightness: F1 = 218.6, P < 1 × 10⁻¹⁵; dorsal hue: F1= 18.4, P = 2.4 × 10⁻⁵; ventral brightness: F1 = 61.0, P = 1.5 × 10⁻¹³; dorsal–ventral boundary: F1 = 104.6, P < 1 × 10⁻¹⁵; tail stripe: F1 = 170.2, P < 1 × 10¹⁵, with the corresponding P-values given to the right of each panel. A sixth color trait (ventral hue [PC4]; [F1 = 1.1, P = 0.30]) and four noncolor traits (total body length [F1= 0.11, P = 0.74], tail length [F1 = 0.18, P = 0.67], hind foot length [F1= 3.0, P = 0.084], and ear length [F1= 0.48, P = 0.49]) did not differ significantly between habitats (see supplementary fig. 10 and table 11, Supplementary Material online).
<sc>Fig</sc>. 3.
Fig. 3.
Association mapping results for Agouti SNPs and five color traits. Each point represents one of 2,148 Agouti SNPs included in the association mapping analysis, with position (on scaffold 16, see Materials and Methods) indicated on the x-axis and PIP estimated using a BSLMM in GEMMA on the y-axis. PIP values, which approximate the strength of the association between genotype and phenotype, were averaged across ten independent GEMMA runs. Black dots indicate SNPs with PIP > 0.1, dashed lines give the location of six candidate SNPs identified in a previous association mapping analysis of a single population (associated with tail stripe, D-V boundary, as well as dorsal brightness and hue; Linnen et al. 2013), gray lines give the location of Agouti exons, and arrows indicate two alternative transcription start sites.
<sc>Fig</sc>. 4.
Fig. 4.
Genetic structure of populations on and off the Sand Hills. (A) PCA shows that individuals cluster according to their geographic sampling location, with a clear separation of individuals sampled on the Sand Hills (SH; green) from off the Sand Hills (blue). (B) TreeMix results for the tree that best fit the covariance in allele frequencies across samples. (C) An isolation-by-distance model is supported by a significant correlation between pairwise genetic differentiation (FST/[1 − FST]) and pairwise geographic distance among sampling sites. Significance of the Mantel test was assessed through 10,000 permutations. (D) Spatial interpolation of the ancestry proportion inferred, accounting for geographic sampling location, using TESS3 for K = 3 groups. Individuals are represented as dots, and the ancestry of the three groups is represented by a gradient of three colors. (E) Individual admixture proportions (inferred using TESS3) are consistent with IBD and reduced differentiation among populations. The number of clusters (K) best explaining the data was assessed as the K value reaching the lowest minimal cross-entropy at K =3. All analyses were based on a subset of 161 individuals showing a mean depth of coverage larger than 8×, with all genotypes possessing a minimum coverage of 4×, sampling one SNP for each 1.5-kb block, resulting in a data set with 5,412 SNPs (supplementary table 8, Supplementary Material online).
<sc>Fig</sc>. 5.
Fig. 5.
Genetic differentiation across the Agouti locus. Genetic differentiation observed between populations on the Sand Hills and populations north of the Sand Hills (top panel), populations on the Sand Hills and populations south of the Sand Hills (middle panel), and populations north and south of the Sand Hills. Dotted lines indicate the genome-wide average FST between these comparisons. As shown, differentiation is generally greatly elevated across the region, with a number of highly differentiated SNPs particularly when comparing on versus off Sand Hills populations, which correspond to SNPs associated with different aspects of the cryptic phenotype (PIP scores are indicated by the size of the dots as shown in the legend, and significant SNPs are labeled with respect to the associated phenotype). Populations to the north and south of the Sand Hills are also highly differentiated in this region, likely owing to differing levels of gene flow with the Sand Hills populations, yet the SNPs underlying the cryptic phenotype are not differentiated between these dark populations.
<sc>Fig</sc>. 6.
Fig. 6.
Comparison of tests of neutrality and selection across the Agouti locus. From the top: The exon structure, pairwise differences, Tajima’s D, CLR test, HapFLK, and FLK. The dashed lines indicate the significance threshold using parametric bootstrapping of the best-fitting demographic model.

References

    1. Aeschbacher S, Burger R.. 2014. The effect of linkage on establishment and survival of locally beneficial mutations. Genetics 1971: 317–336. 10.1534/genetics.114.163477 - DOI - PMC - PubMed
    1. Akaike H. 1974. New look at statistical-model identification. IEEE Trans Automat Contr. 196: 716–723. 10.1109/TAC.1974.1100705 - DOI
    1. Bagley RK, Sousa VC, Niemiller ML, Linnen CR.. 2017. History, geography, and host use shape genome-wide patterns of genetic variation in the redhead pine sawfly. Mol Ecol. 264: 1022–1044. 10.1111/mec.13972 - DOI - PubMed
    1. Barsh GS. 1996. The genetics of pigmentation: from fancy genes to complex traits. Trends Genet. 128: 299–305. 10.1016/0168-9525(96)10031-7 - DOI - PubMed
    1. Browning SR, Browning BL.. 2007. Rapid and accurate haplotype phasing and missing-data inference for whole-genome association studies by use of localized haplotype clustering. Am J Hum Genet. 815: 1084–1097. 10.1086/521987 - DOI - PMC - PubMed

Publication types

LinkOut - more resources