

Disproportionately higher unintentional injury mortality among Alaska Native people, 2006-2015
- PMID: 29347890
- PMCID: PMC5774398
- DOI: 10.1080/22423982.2017.1422671
Disproportionately higher unintentional injury mortality among Alaska Native people, 2006-2015
Abstract
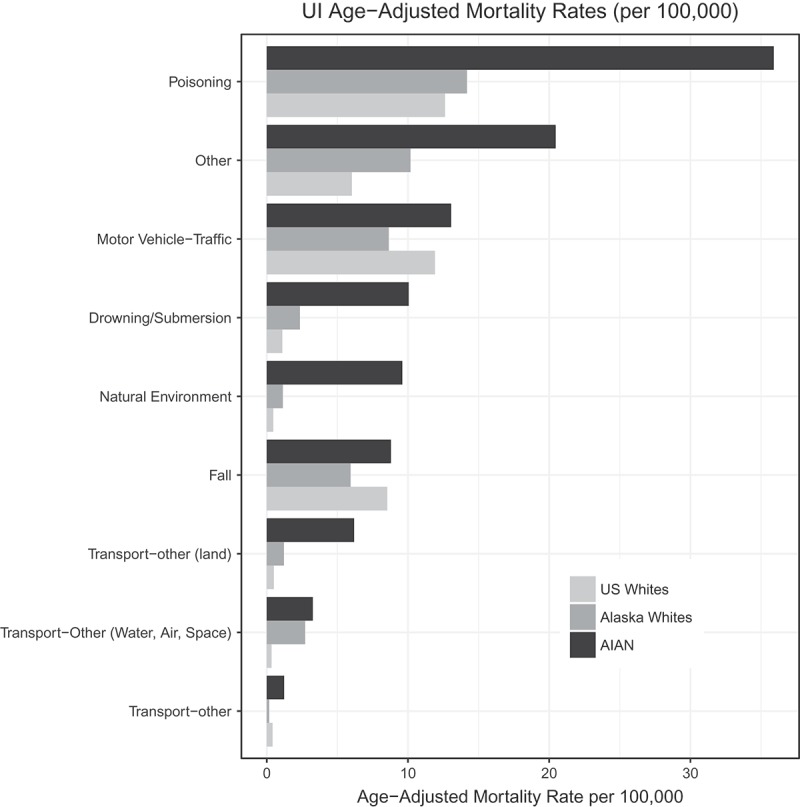
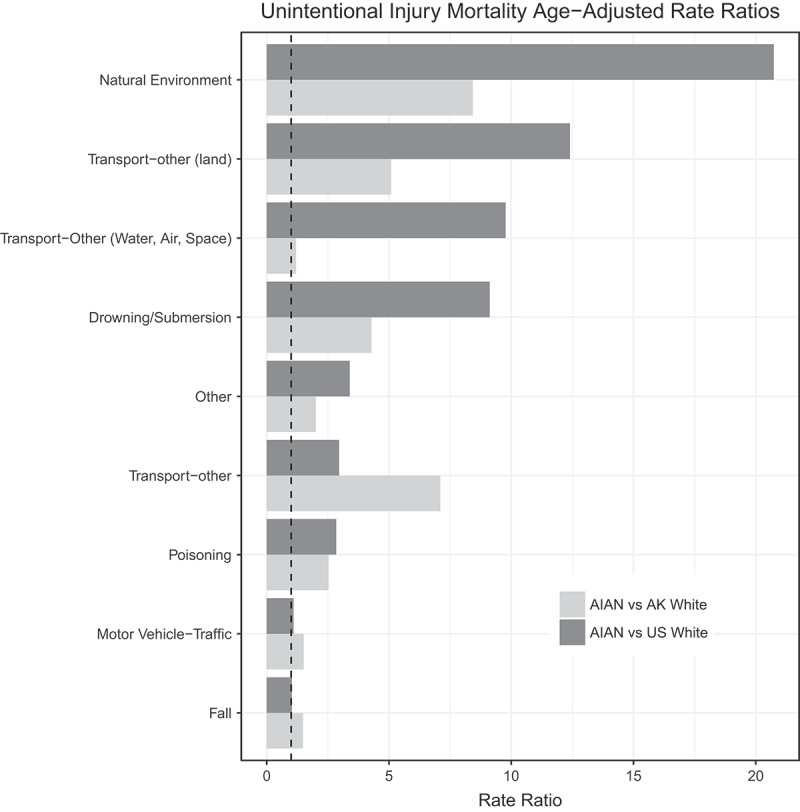
We compared rates of unintentional injury (UI) deaths (total and by injury category) among Alaska Native (AN) people to rates of U.S. White (USW) and Alaska White (AKW) populations during 2006-2015. The mortality data for AN and AKW populations were obtained from Alaska Bureau of Vital Statistics and USW mortality data were obtained from WISQARS, the Center for Disease Control and Prevention online injury data program. AN and AKW rates were age-adjusted to the U.S. 2000 Standard Population and rate ratios (RR) were calculated. AN people had higher age-adjusted total UI mortality than the USW (RR = 2.6) and AKW (RR = 2.3) populations. Poisoning was the leading cause of UI death among AN people (35.9 per 100,000), more than twice that of USW (RR = 2.9) and AKW (RR = 2.5). Even greater disparities were found between AN people and USW for: natural environment (RR = 20.7), transport-other land (RR = 12.4), and drowning/submersion (RR = 9.1). Rates of AN UI were markedly higher than rates for either USW or AKW. Identifying all the ways in which alcohol/drugs contribute to UI deaths would aid in prevention efforts. All transportation deaths should be integrated into one fatality rate to provide more consistent comparisons between groups.
Keywords: Alaska Native; Mortality; Poisoning; Unintentional Injury; Urban-Rural.
Conflict of interest statement
No potential conflict of interest was reported by the authors.
Figures
Similar articles
-
Alaska native mortality rates and trends.Public Health Rep. 2009 Jan-Feb;124(1):54-64. doi: 10.1177/003335490912400109. Public Health Rep. 2009. PMID: 19413028 Free PMC article.
-
Unintentional injury mortality among American Indians and Alaska Natives in the United States, 1990-2009.Am J Public Health. 2014 Jun;104 Suppl 3(Suppl 3):S470-80. doi: 10.2105/AJPH.2013.301854. Epub 2014 Apr 22. Am J Public Health. 2014. PMID: 24754624 Free PMC article.
-
Mortality trends among Alaska Native people: successes and challenges.Int J Circumpolar Health. 2013 Aug 5;72. doi: 10.3402/ijch.v72i0.21185. eCollection 2013. Int J Circumpolar Health. 2013. PMID: 23977643 Free PMC article.
-
Trends in injury-related mortality among residents of Jiangsu Province from 2012 to 2021: an age-period-cohort analysis.Front Public Health. 2024 Jun 11;12:1373238. doi: 10.3389/fpubh.2024.1373238. eCollection 2024. Front Public Health. 2024. PMID: 38919918 Free PMC article.
-
Unintentional injuries in developing countries: the epidemiology of a neglected problem.Epidemiol Rev. 1991;13:228-66. doi: 10.1093/oxfordjournals.epirev.a036070. Epidemiol Rev. 1991. PMID: 1765113 Review.
Cited by
-
Trends and disparities in American Indian/Alaska Native unintentional injury mortality from 1999 to 2016.Inj Prev. 2021 Oct;27(5):435-441. doi: 10.1136/injuryprev-2020-043951. Epub 2020 Oct 22. Inj Prev. 2021. PMID: 33093126 Free PMC article.
-
Experiences of Alaska Native people living with burn injury and opportunities for health system strengthening.BMC Health Serv Res. 2023 Nov 15;23(1):1260. doi: 10.1186/s12913-023-10243-x. BMC Health Serv Res. 2023. PMID: 37968627 Free PMC article.
References
-
- Dessypris N, Dikalioti SK, Skalkidis I, et al. Combating unintentional injury in the USA: lessons learned from the ICD-10 classification period. J Trauma. 2009;66(2):519–10. - PubMed
-
- The Alaska Native Tribal Health Consortium Injury Prevention Program Data from 2002-2006*[internet] Anchorage: Alaska Native Tribal Health Consortium; [cited March 12 2012]. Available from: http://www.anthc.org/chs/wp/injprev/upload/Alaska-Native-Injury-Facts-1-...
-
- U.S. Census Bureau State and county quick facts. Data derived from Population Estimates, Census of Population and Housing. Washington [DC]: U.S. Census Bureau; 2011. cited 2013 September10 Available from http://quickfacts.census.gov/qfd/states/02000.html
-
- U.S. Fish and Wildlife Service, Office of Subsistence Management (2016). The federal subsistence management program cited 2016 September15 Available from: https://www.doi.gov/sites/doi.gov/files/uploads/Subsistence%20Management...
MeSH terms
LinkOut - more resources
Full Text Sources
Other Literature Sources
Medical