. 2018 Apr;208(4):1565-1584.
doi: 10.1534/genetics.117.300489. Epub 2018 Jan 18.

Detecting Polygenic Adaptation in Admixture Graphs

Affiliations

Detecting Polygenic Adaptation in Admixture Graphs

Fernando Racimo et al. Genetics. 2018 Apr.

Abstract

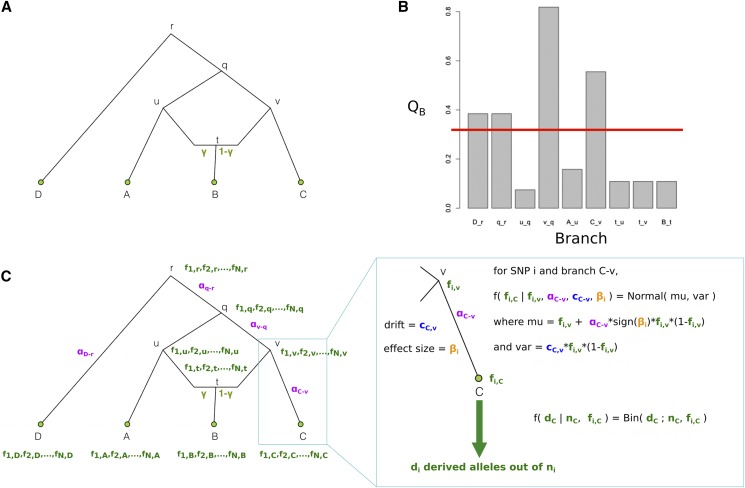
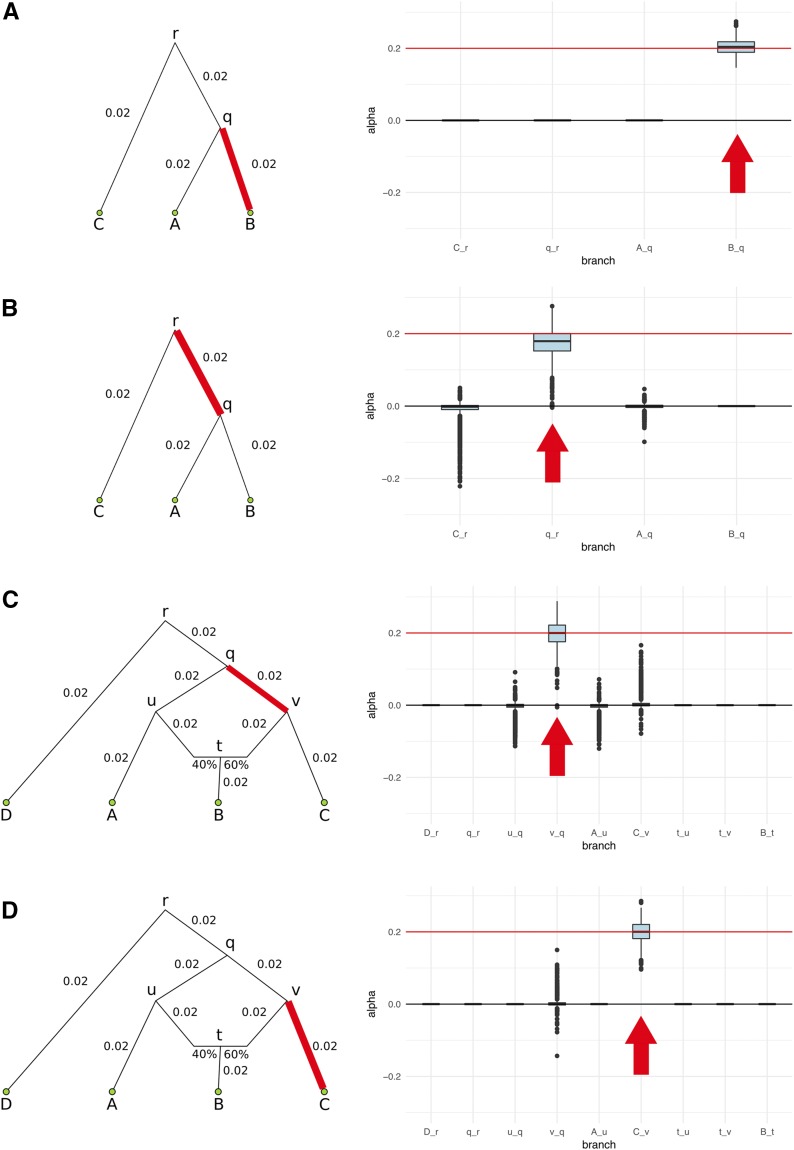
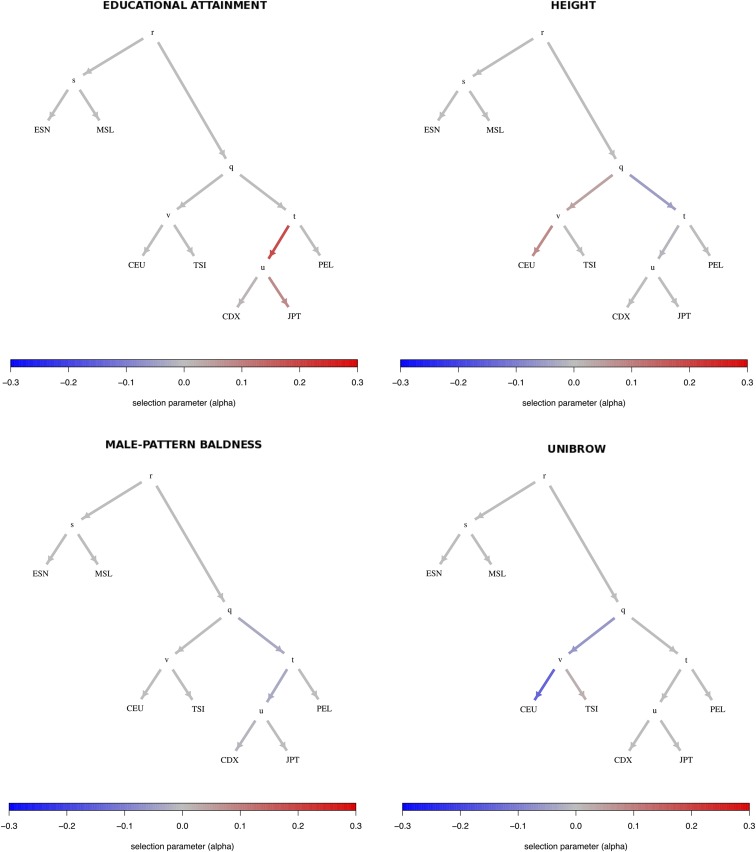
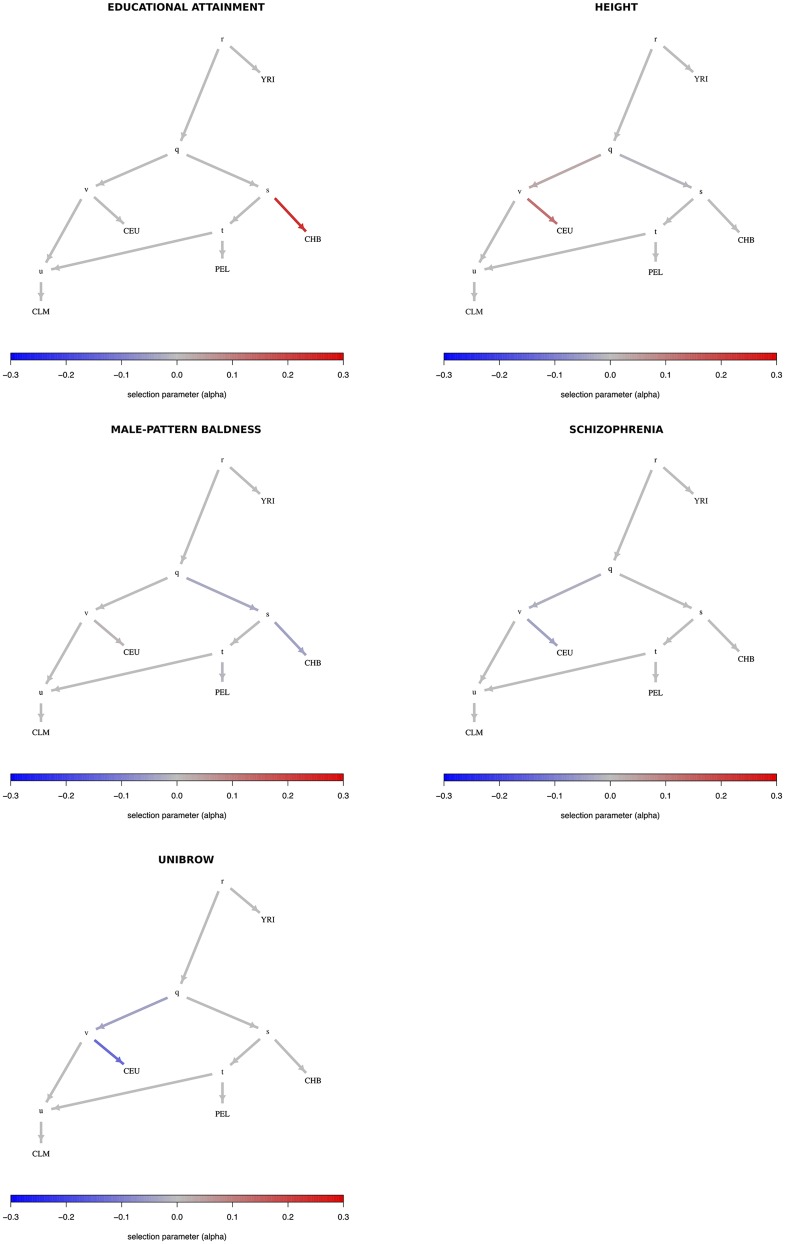
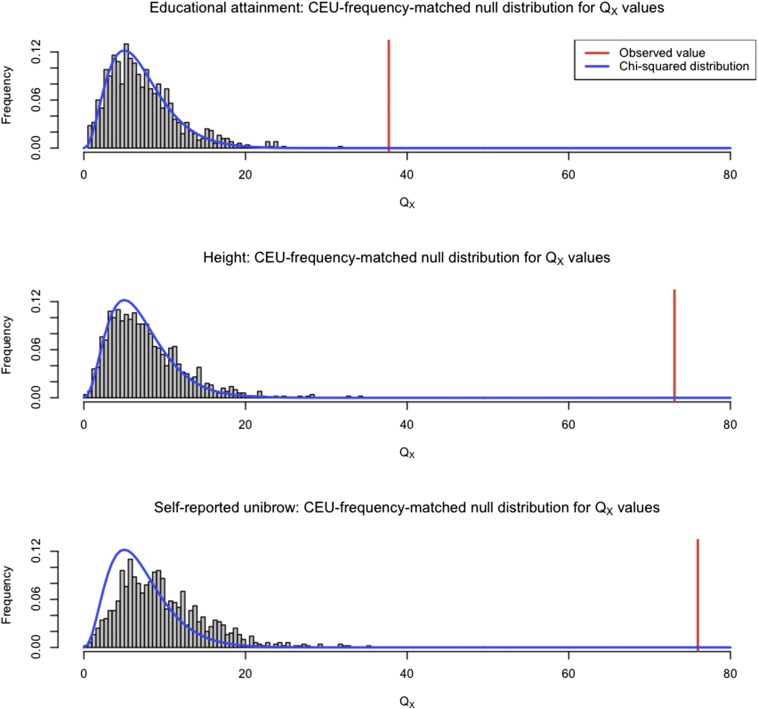
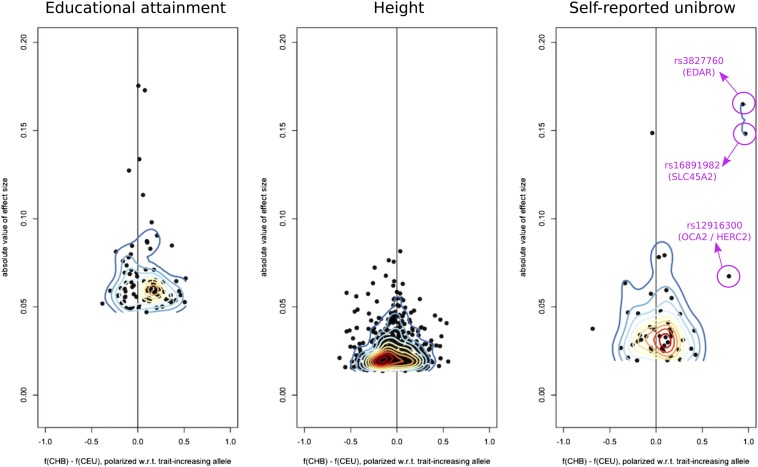
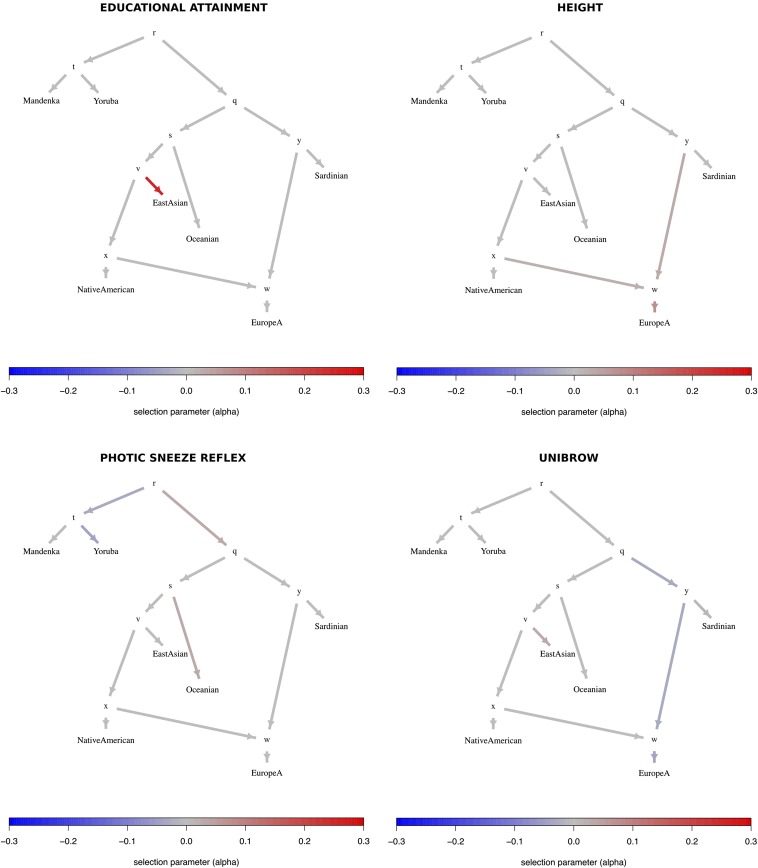
An open question in human evolution is the importance of polygenic adaptation: adaptive changes in the mean of a multifactorial trait due to shifts in allele frequencies across many loci. In recent years, several methods have been developed to detect polygenic adaptation using loci identified in genome-wide association studies (GWAS). Though powerful, these methods suffer from limited interpretability: they can detect which sets of populations have evidence for polygenic adaptation, but are unable to reveal where in the history of multiple populations these processes occurred. To address this, we created a method to detect polygenic adaptation in an admixture graph, which is a representation of the historical divergences and admixture events relating different populations through time. We developed a Markov chain Monte Carlo (MCMC) algorithm to infer branch-specific parameters reflecting the strength of selection in each branch of a graph. Additionally, we developed a set of summary statistics that are fast to compute and can indicate which branches are most likely to have experienced polygenic adaptation. We show via simulations that this method-which we call PolyGraph-has good power to detect polygenic adaptation, and applied it to human population genomic data from around the world. We also provide evidence that variants associated with several traits, including height, educational attainment, and self-reported unibrow, have been influenced by polygenic adaptation in different populations during human evolution.

Keywords: GWAS; admixture; complex traits; polygenic adaptation; selection.


Figures

Figure 1
Figure 1
Schematic of drift values (c) and allele frequencies (f) for a three-leaf population tree with no admixture.
Figure 2
Figure 2
Schematic of PolyGraph estimation procedure for a four-population graph with one admixture event. (A) The first step is the estimation of the admixture graph topology using neutral SNP data, via an admixture-graph fitting program like MixMapper. (B) Then, we use the QB statistic to determine which branches to explore in the MCMC. Selection parameters whose corresponding branches have a QB statistic that is smaller than a specific cutoff (red line) are set to a fixed value of 0 in the MCMC. (C) Model for MCMC sampling. The SNP frequencies in the nodes of the graph are shown in green, while the selection parameters for each candidate branch are shown in purple. For each SNP, the likelihood of each branch of the graph is a Normal distribution. To model the sampling of derived alleles in the leaves of the graph, we use a binomial distribution.
Figure 3
Figure 3
We simulated 400 SNPs affecting a trait under polygenic adaptation, and then used our MCMC to obtain posterior distributions of the α parameters for each branch. The red arrows denote the selected branch. The red line in the box-plots denotes the simulated value of α (in this case, 0.2). The lower, middle, and upper hinges denote the 25th, 50th, and 75th percentiles, respectively. The upper whisker extends to the highest value that is within 1.5 * IQR of the upper hinge, where IQR is the inter-quartile range. The lower whisker extends to the lowest value within 1.5 * IQR of the lower hinge. Data beyond the whiskers are plotted as points. The numbers in each graph denote the drift lengths and admixture proportions. (A) Three-leaf tree with selection in a terminal branch (B-q). (B) Three-leaf tree with selection in an internal branch (q-r). (C) Four-population admixture graph with selection in an internal branch (v-q). (D) Four-population admixture graph with selection in a terminal branch (C-v).
Figure 4
Figure 4
Poly-graphs for trait-associated variants that show significant evidence for polygenic adaptation in the seven-leaf tree built using 1000 Genomes allele frequency data. ESN, Nigerian Esan; MSL, Sierra Leone Mende; CEU, Northern Europeans from Utah; TSI, Southern Europeans from Tuscany; CDX, Dai Chinese; JPT, Japanese; PEL, Peruvians.
Figure 5
Figure 5
Poly-graphs for trait-associated variants that show significant evidence for polygenic adaptation in the five-leaf admixture graph built using 1000 Genomes allele frequency data. CEU, Northern Europeans from Utah; TSI, Southern Europeans from Tuscany; PEL, Peruvians; CLM, Colombians; YRI, Yoruba; CHB, Han Chinese.
Figure 6
Figure 6
We generated an empirical null distribution by sampling SNPs from the genome that matched the CEU allele frequency of the SNPs associated with educational attainment, self-reported unibrow, and height. We generated 1000 samples this way, and computed the QX statistic for each sample, using the population panels from Figure 4. The QX value observed in the real data are depicted with a red line. We also plot the density of the corresponding χ2 distribution (blue line) for comparison.
Figure 7
Figure 7
We plotted the absolute value of the effect sizes of trait-associated SNPs for height, educational attainment, and self-reported unibrow, as a function of the difference in frequency observed between CHB and CEU. The panel frequencies are polarized with respect to the trait-increasing allele. We then overlaid a contour plot over each scatter-plot.
Figure 8
Figure 8
Poly-graphs for trait-associated variants that show significant evidence for polygenic adaptation in the seven-leaf admixture graph built using the Lazaridis et al. (2014) dataset and including the set of European populations with low EEF ancestry (“EuropeA”).

References

    1. Auton A., Abecasis G. R., Altshuler D. M., Durbin R. M., Bentley D. R., et al. , 2015. A global reference for human genetic variation. Nature 526: 68–74. - PMC - PubMed
    1. Barton N. H., de Vladar H. P., 2009. Statistical mechanics and the evolution of polygenic quantitative traits. Genetics 181: 997–1011. - PMC - PubMed
    1. Beauchamp J. P., 2016. Genetic evidence for natural selection in humans in the contemporary United States. Proc. Natl. Acad. Sci. USA 113: 7774–7779. - PMC - PubMed
    1. Berg J. J., Coop G., 2014. A population genetic signal of polygenic adaptation. PLoS Genet. 10: e1004412. - PMC - PubMed
    1. Berg J. J., Zhang X., Coop G., 2017. Polygenic adaptation has impacted multiple anthropometric traits. bioRxiv. https://doi.org/10.1101/167551. - DOI

Publication types