

FBXL13 directs the proteolysis of CEP192 to regulate centrosome homeostasis and cell migration
- PMID: 29348145
- PMCID: PMC5836097
- DOI: 10.15252/embr.201744799
FBXL13 directs the proteolysis of CEP192 to regulate centrosome homeostasis and cell migration
Abstract
Aberrant centrosome organisation with ensuing alterations of microtubule nucleation capacity enables tumour cells to proliferate and invade despite increased genomic instability. CEP192 is a key factor in the initiation process of centrosome duplication and in the control of centrosome microtubule nucleation. However, regulatory means of CEP192 have remained unknown. Here, we report that FBXL13, a binding determinant of SCF (SKP1-CUL1-F-box)-family E3 ubiquitin ligases, is enriched at centrosomes and interacts with the centrosomal proteins Centrin-2, Centrin-3, CEP152 and CEP192. Among these, CEP192 is specifically targeted for proteasomal degradation by FBXL13. Accordingly, induced FBXL13 expression downregulates centrosomal γ-tubulin and disrupts centrosomal microtubule arrays. In addition, depletion of FBXL13 induces high levels of CEP192 and γ-tubulin at the centrosomes with the consequence of defects in cell motility. Together, we characterise FBXL13 as a novel regulator of microtubule nucleation activity and highlight a role in promoting cell motility with potential tumour-promoting implications.
Keywords: CEP192; FBXL13; F‐box protein; centrosome; ubiquitin.
© 2018 The Authors.
Figures
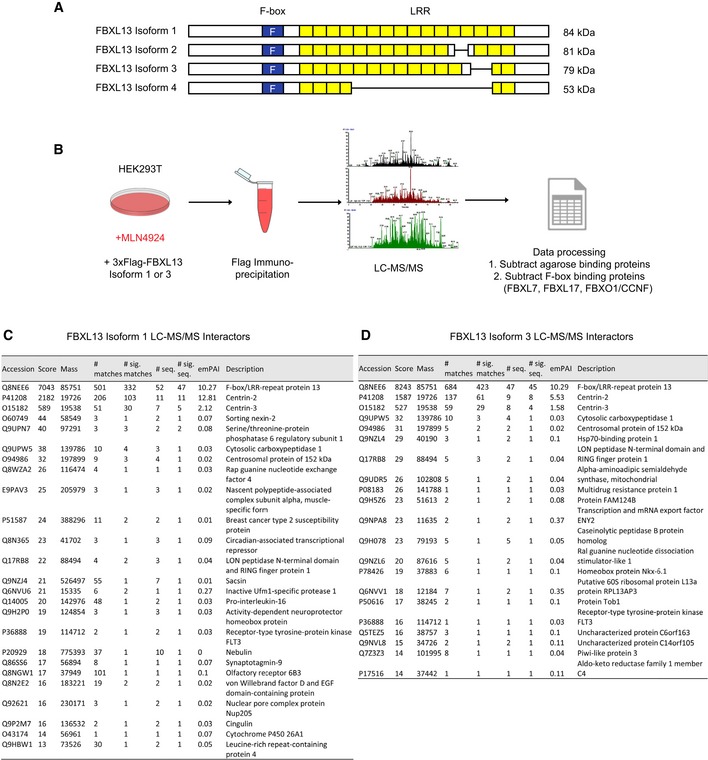
- A
Scheme representing FBXL13 isoform 1 and 3. The F‐box domain is highlighted in blue and leucine‐rich repeats (LRR) in yellow.
- B
Strategy of liquid chromatography tandem mass spectrometry (LC‐MS/MS). Flag‐tagged FBXL13 was overexpressed and immunopurified from HEK293T cells treated with MLN4924 (2 μM). Candidate interactors were processed by subtracting agarose‐binding proteins available from the Contaminant Repository of Affinity Purification, and common interactors with three other F‐box proteins (FBXL7, FBXL17 and FBXO1/CCNF).
- C, D
The table represents the FBXL13 isoform 1 interactors (C) or the FBXL13 isoform 3 interactors (D) identified from 3xFlag‐tagged FBXL13 immunoprecipitation experiments followed by liquid chromatography–mass spectrometry (LC‐MS/MS). Results were scored according to probability‐based Mowse score of −10*Log(P), where P is the probability that the matched peptide is a random event, and the exponentially modified protein abundance index (emPAI).
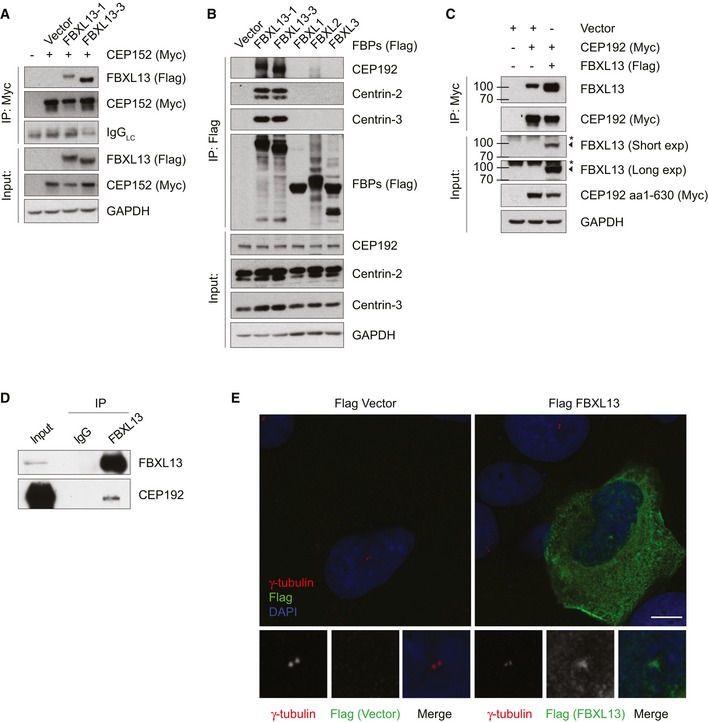
Detection of Flag‐tagged FBXL13‐1 or FBXL13‐3 binding to immunoprecipitated Myc‐tagged CEP152 in HEK293T cells. An empty vector (Vector) was used as a negative control.
Detection of CEP192, Centrin‐2 and Centrin‐3 after immunoprecipitation of the indicated Flag‐tagged F‐box proteins (FBPs) in HEK293T cells. An empty vector (Vector) was used as a negative control.
Detection of endogenous FBXL13 binding to immunoprecipitated Myc‐tagged CEP192 (aa 1–630) in U2OS cells. An empty vector (Vector) was used as a negative control, and Flag‐tagged FBXL13‐1 was used as a positive control. The asterisk marks a non‐specific band, FBXL13 is marked by an arrowhead.
Detection of endogenous CEP192 binding to immunoprecipitated endogenous FBXL13 in HEK293T cells. Normal rabbit IgG antibody was used as a negative control.
Representative images of U2OS cells transfected with Flag‐FBXL13 or an empty vector control (Flag Vector). Cells were fixed with methanol and stained for γ‐tubulin (red), FBXL13 (Flag, green) and DNA (DAPI, blue). Scale bar, 10 μm.
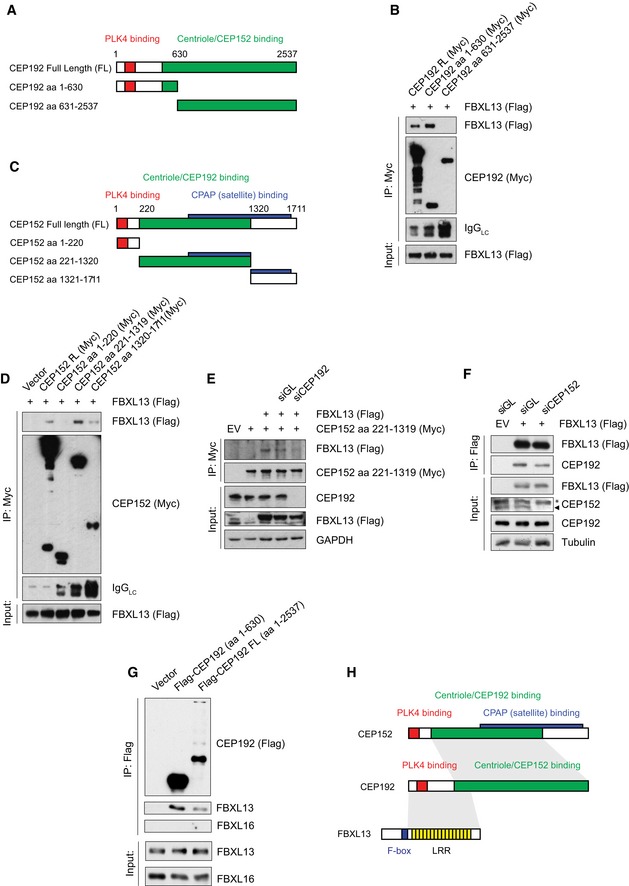
Scheme of the CEP192 full‐length (FL) protein and truncation mutants. The coloured regions show the PLK4 binding region (red) and the centriole and CEP152 binding region (green).
Detection of Flag‐FBXL13 binding to immunoprecipitated Myc‐tagged CEP192 truncation mutants. HEK293T cells were co‐transfected with Flag‐FBXL13 and CEP192 full length (FL) or two truncation mutants (aa 1–630 and aa 631–2,537) as indicated.
Scheme of CEP152 full‐length (FL) protein and truncation mutants. The coloured regions show the PLK4 binding region (red), the centriole and CEP192 binding region (green) and the CPAP binding region (blue).
Detection of Flag‐FBXL13 binding to immunoprecipitated Myc‐tagged CEP152 truncation mutants. HEK293T cells were co‐transfected with Flag‐FBXL13 and CEP152 full length (FL) or three truncation mutants (aa 1–220, aa 221–1,319 and aa 1,320–1,711) as indicated.
Detection of FBXL13 (Flag) binding to immunoprecipitated Myc‐tagged CEP152 (aa 221–1,319) from U2OS cells, either in the presence of a non‐targeting siRNA (siGL) or an siRNA against CEP192 (siCEP192).
Detection of endogenous CEP192 binding to immunoprecipitated Flag‐tagged FBXL13 from HEK293T cells, either in the presence of a non‐targeting siRNA (siGL) or an siRNA against CEP152 (siCEP152). The asterisk marks a non‐specific band, CEP152 is marked by an arrowhead.
Detection of purified FBXL13 binding to immunoprecipitated Flag‐tagged CEP192 (FL and aa 1–602) assessed by an in vitro binding assay. FBXL16 binding was used as a negative control. CEP192 constructs were synthesised in vitro using a T7‐coupled reticulocyte lysate. FBXL13 and FBXL16 were expressed and purified from insect cells.
Scheme summarising the interactions between FBXL13, CEP192 and CEP152.
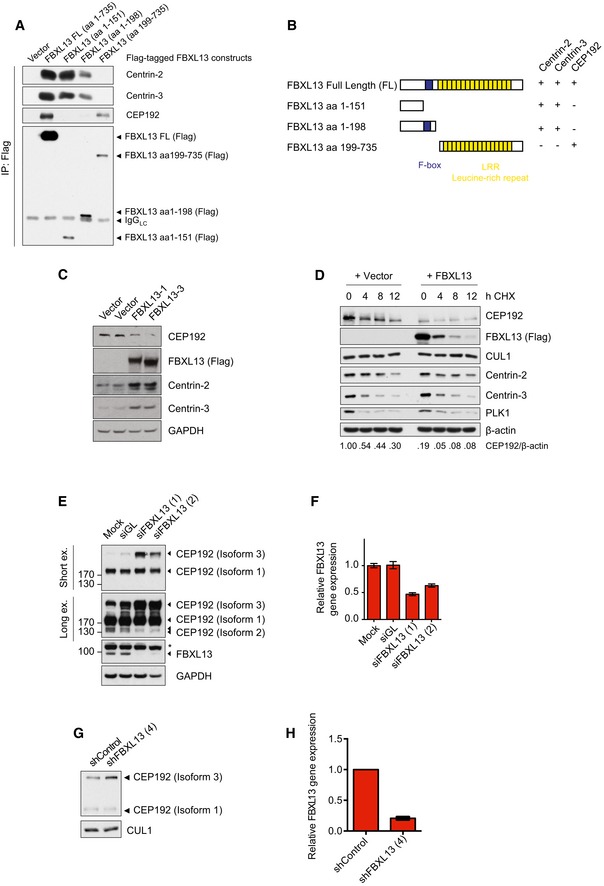
Detection of endogenous Centrin‐2, Centrin‐3 and CEP192 binding to immunoprecipitated Flag‐tagged FBXL13 FL (FL, full length) and fragments from HEK293T cells. An empty vector (Vector) was used as a negative control.
Scheme of FBXL13 full length (FL) and truncation mutants. The F‐box domain is highlighted in blue. The ability of each mutant to bind to Centrin‐2, Centrin‐3 and CEP192 is summarised on the right.
Protein levels of endogenous CEP192, Centrin‐2 and Centrin‐3 in HEK293T cells transfected with FBXL13 isoform 1 (FBXL13‐1), FBXL13 isoform 3 (FBXL13‐3) or an empty vector (Vector) control. GAPDH was used as a loading control.
Protein levels of endogenous CEP192, Centrin‐2 and Centrin‐3 levels in U2OS cells following cycloheximide (CHX) treatment and overexpression of FBXL13 or an empty vector (Vector) control. CUL1 and PLK1 were measured as negative and positive controls for the CHX treatment, respectively. β‐Actin was used as a loading control. Protein band intensities were measured using ImageJ. The ratio of CEP192 to β‐actin was calculated and normalised to protein levels at time point 0 h CHX of the vector control.
Detection of endogenous CEP192 protein levels following FBXL13 depletion by siRNA. U2OS cells were either mock transfected (Mock) or transfected either with siRNAs targeting Luciferase (siGL) or two siRNAs targeting FBXL13 (1 and 2). Two exposures of CEP192 are shown (Short ex. and Long ex.). GAPDH was used as a loading control. The asterisk marks a non‐specific band, FBXL13 is marked by an arrowhead.
Quantification of FBXL13 mRNA levels measured by qPCR from experiment depicted in (E) (mean ± SD from three qPCR triplicates).
Detection of CEP192 protein levels following FBXL13 depletion by shRNA. U2OS cells were transiently transfected with expression vectors for control shRNA or shRNA targeting FBXL13. Following 48 h, cells were harvested and protein levels were analysed by Western blot. CUL1 was used as a loading control.
Quantification of FBXL13 mRNA levels measured by qPCR from experiment depicted in (G) (mean ± SD from three qPCR triplicates).
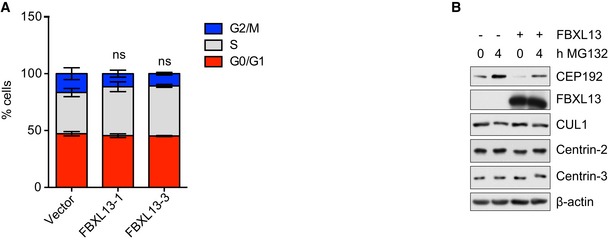
Quantification of cell cycle profile of HEK293T cells as determined by fluorescence‐activated cell sorting (FACS) using propidium iodide staining. HEK293T cells were transfected with FBXL13 isoform 1 (FBXL13‐1) or FBXL13 isoform 3 (FBXL13‐3). An empty vector (Vector) was used as a negative control (mean ± SD from three independent experiments; ns, non‐significant P > 0.05). The statistical method used was a one‐sample, unpaired Student's t‐test with a hypothetical means of 1.0 between G2/M populations of the treatment conditions compared to control.
Detection of CEP192, Centrin‐2, Centrin‐3 and CUL1 after expression of FBXL13 in the presence or absence of MG‐132. β‐actin was used as a loading control.
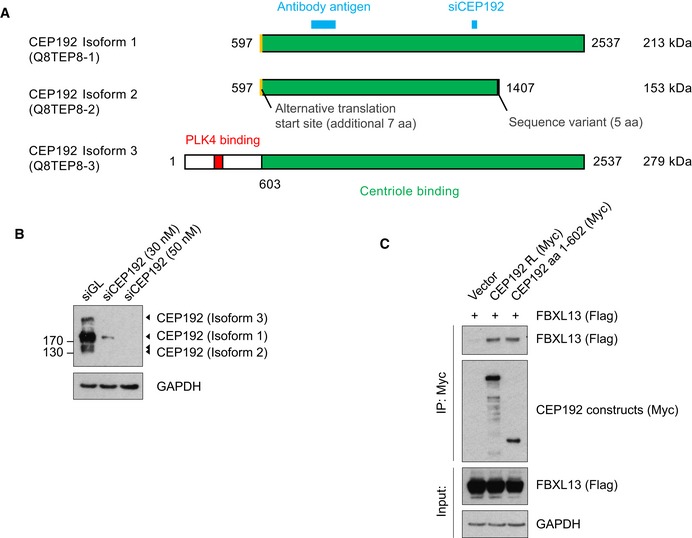
CEP192 (Uniprot ID: Q8TEP8) has three isoforms. The PLK4 binding region is shown in red and the centriole binding region in green. The two shorter isoforms (1 and 2) are generated through an alternative translation start site reported by Sonnen et al 8, shown in yellow. CEP192 isoform 2 also contains a sequence variant of 5 amino acids at its C‐terminus. The antibody used in this study recognises the antigen shown in blue. The siCEP192 sequence used in this study targets all three isoforms and is also shown in blue.
CEP192 protein levels in U2OS cells following transfection with a non‐targeting siRNA control (siGL) or an siRNA targeting CEP192.
Detection of Flag‐FBXL13 binding to immunoprecipitated Myc‐tagged CEP192 full length (FL) or a truncation mutant (aa 1–602) specific to CEP192‐3. CEP192 and FBXL13 were co‐transfected in HEK293T cells as indicated.
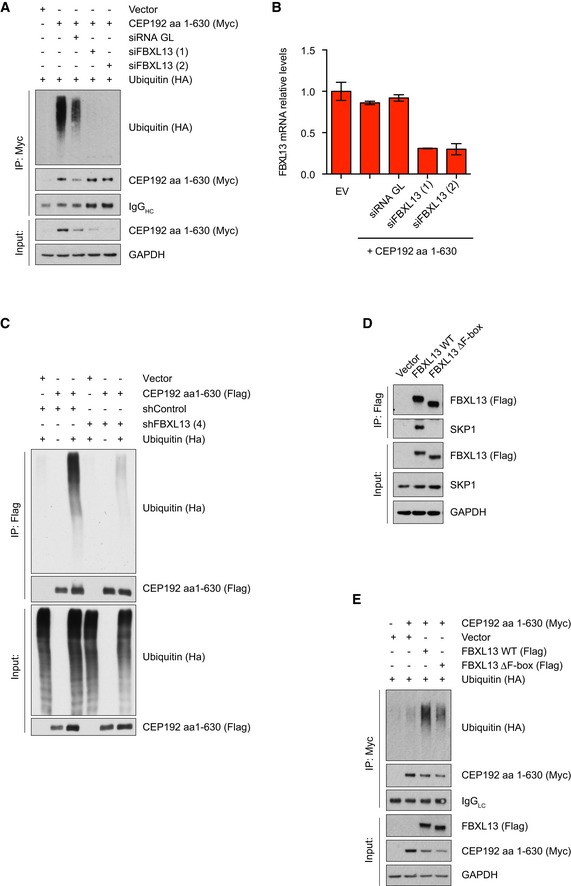
Detection of polyubiquitylated Myc‐tagged CEP192 (aa 1–630) following immunoprecipitation from U2OS cells. Cells were co‐transfected with HA‐tagged ubiquitin and either a non‐targeting siRNA (siGL) or two siRNAs against FBXL13 (1) and (2). An empty vector (Vector) was used as a negative control.
Relative FBXL13 mRNA levels in U2OS samples collected in (A) measured by qPCR, following depletion with either a non‐targeting siRNA (siGL) or two siRNAs against FBXL13 (1) and (2) (mean ± SD from three qPCR triplicates).
Detection of polyubiquitylated Flag‐tagged CEP192 (aa 1–630) following immunoprecipitation from HEK293T cells under denaturing conditions. Cells were co‐transfected with HA‐tagged ubiquitin and either a scrambled or FBXL13 shRNA.
Detection of SKP1 binding to immunoprecipitated Flag‐tagged FBXL13 wild type (WT) or a mutant lacking the F‐box (FBXL13 ∆F‐box) from HEK293T cells. An empty vector (Vector) was used as a negative control.
Detection of polyubiquitylated Myc‐tagged CEP192 (aa 1–630) following immunoprecipitation from HEK293T cells. Cells were co‐transfected with HA‐tagged ubiquitin either in the presence of FBXL13 wild type (WT) or a mutant lacking the F‐box (∆F‐box). An empty vector (Vector) was used as a negative control.
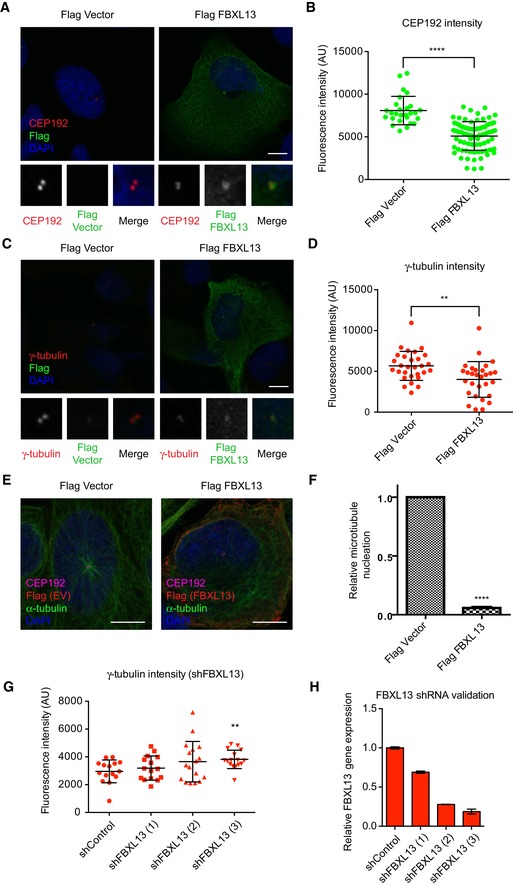
Representative images of U2OS cells transfected with Flag‐FBXL13 or an empty vector control (Flag Vector), fixed with methanol and stained for CEP192 (red), FBXL13 (Flag, green) and DNA (DAPI, blue). Scale bar, 10 μm.
Quantified CEP192 fluorescence intensity associated with the centrosomes following FBXL13 overexpression in the samples represented in (A) (mean ± SD from n > 30 cells per condition, experiments were performed in triplicate; ****P ≤ 0.0001) (Mann‐Whitney test non‐parametric).
Representative images of U2OS cells transfected with Flag‐FBXL13 or an empty vector control (Flag Vector), fixed with methanol and stained for γ‐tubulin (red), FBXL13 (Flag, green) and DNA (DAPI, blue). Scale bar, 10 μm.
Quantified γ‐tubulin fluorescence intensity associated with the centrosomes following FBXL13 overexpression in the samples represented in (C) (mean ± SD from n > 30 cells per condition, experiments were performed in triplicate; **P ≤ 0.01) (Mann‐Whitney test non‐parametric).
Representative images of U2OS cells transfected with either Flag‐FBXL13 or an empty vector control. Cells were fixed with methanol and stained for FBXL13 (Flag, red), CEP192 (magenta), microtubules (α‐tubulin, green) and DNA (DAPI, blue). Scale bar, 10 μm.
Quantification of cells with centrosomal microtubule arrays in Flag‐FBXL13 negative and positive cells. Values were normalised to empty vector transfected cells (mean ± SD from n > 200 cells per condition, experiments were performed in triplicate; ****P ≤ 0.0001) (one‐sample t‐test with hypothetical means of 1.0).
Quantified γ‐tubulin fluorescence intensity in U2OS cells stably expressing shRNA control (shControl) or three shRNA oligos targeting FBXL13 (1, 2, 3) (mean ± SD from n > 30 cells per condition, experiments were performed in triplicate; **P ≤ 0.01) (Mann‐Whitney test non‐parametric).
Validation of FBXL13 mRNA level using quantitative real‐time PCR (qPCR) in the samples shown in (G) (mean ± SD from three qPCR triplicates).
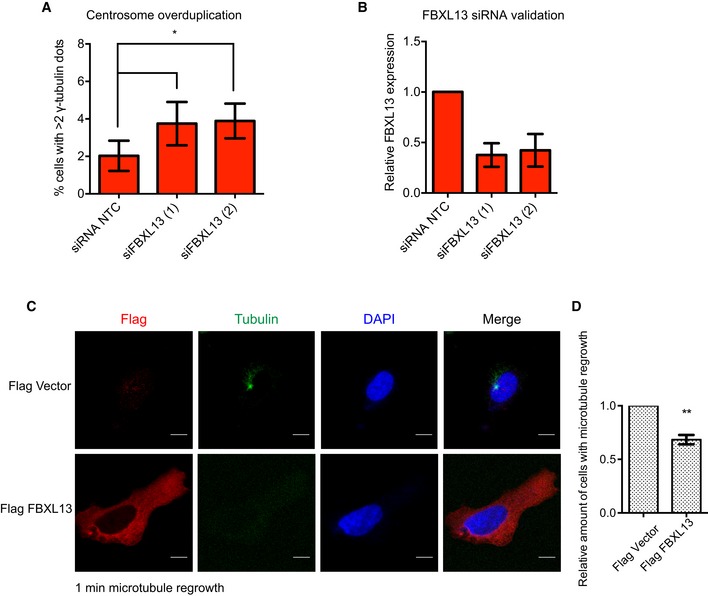
Quantification of centrosome overduplication in U2OS cells transfected with a non‐targeting siRNA (siRNA NTC) or two siRNA oligos targeting FBXL13 (1 and 2) (mean ± SD from three independent experiments, n > 200 cells per condition; *P ≤ 0.05). Statistical analysis was performed by using one‐sample t‐test with hypothetical means of 1.0.
Validation of FBXL13 mRNA level using quantitative real‐time PCR (qPCR) in the samples shown in (A) (mean ± SD from three qPCR triplicates).
Microtubule regrowth assay in U2OS cells transfected with either Flag‐FBXL13 or an empty vector control. Microtubules were fully depolymerised by treating cells with 10 μM nocodazole for 2 h at 4°C. Cells were fixed 1 min after nocodazole washout and stained for Flag (red), α‐tubulin (green) and DNA (DAPI, blue). Scale bar, 10 μm.
Quantification of cells which nucleated centrosomal microtubules after complete depolymerisation shown in (C) (mean ± SD from three independent experiments, n = 100 cells per condition and experiment, **P ≤ 0.01). Statistical analysis was performed by using one‐sample t‐test with hypothetical means of 1.0.
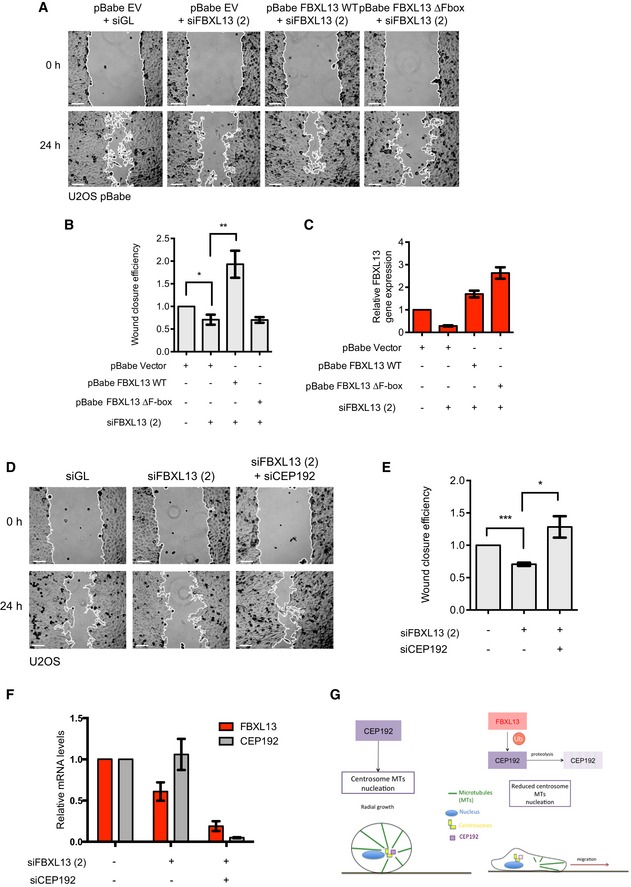
Representative images from a wound healing assay of pBabe U2OS cells stably expressing the empty vector backbone (pBabe EV) or siRNA‐resistant FBXL13 wild type (pBabe FBXL13 WT) or FBXL13 lacking the F‐box (pBabe FBXL13 ∆F‐box). Cells were transfected with a control siRNA (siGL) or an siRNA targeting FBXL13 (2). The wound edge is shown in white. Scale bar, 100 μm.
Quantification of wound closure efficiency shown in (A) as calculated by the percentage of wound area closed (mean ± SD, n = 6, *P ≤ 0.05, **P ≤ 0.01). Statistical analysis of relative ratios was performed by using one‐sample t‐test with hypothetical means of 1.0 and differences between groups were compared using unpaired Student's t‐test.
Validation of FBXL13 mRNA level using quantitative real‐time PCR (qPCR) in the samples shown in (A) (mean ± SD from three qPCR triplicates).
Representative images from a wound healing assay of U2OS cells transfected with a control siRNA (siGL) or with an siRNA targeting FBXL13 (2) alone or together with an siRNA targeting CEP192 isoform 3 (siCEP192). The wound edge is shown in white. Scale bar, 100 μm.
Quantification of wound closure efficiency shown in (D) as calculated by the percentage of wound area closed (mean ± SD, n = 6, *P ≤ 0.05, ***P ≤ 0.001). Statistical analysis of relative ratios was performed by using one‐sample t‐test with hypothetical means of 1.0 and differences between groups were compared using unpaired Student's t‐test.
Validation of FBXL13 and CEP192 isoform 3 mRNA levels using quantitative real‐time PCR (qPCR) in the samples shown in (D) (mean ± SD from three qPCR triplicates).
Working model in which FBXL13 targets CEP192‐3 for ubiquitin‐mediated proteolysis, resulting in reduced γ‐tubulin recruitment to centrosomes, reduced centrosomal microtubules and increased cell motility via extracentrosomal microtubule arrays.
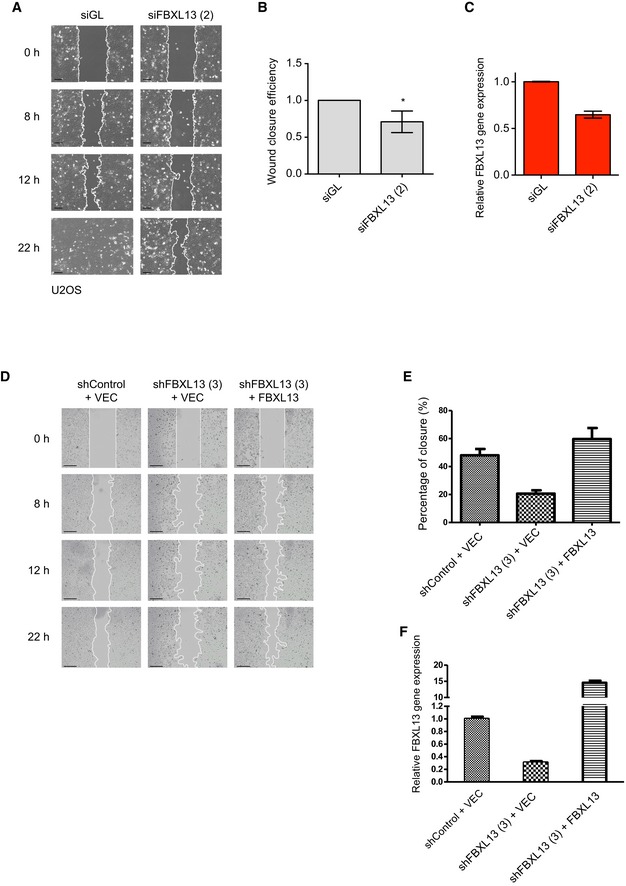
Representative images from a wound healing assay of U2OS cells transfected with a control siRNA (siGL) or an siRNA targeting FBXL13 (2). The wound edge is shown in white. Scale bar, 100 μm.
Quantification of wound closure efficiency shown in (A) as calculated by the percentage of wound area closed (mean ± SD from three independent experiments, n > 4 wounds per condition, *P ≤ 0.05). The statistical method used was a one‐sample, unpaired Student's t‐test with a hypothetical means of 1.0.
Validation of FBXL13 mRNA level in the samples shown in (A) using quantitative real‐time PCR (qPCR; mean ± SD from three qPCR triplicates).
Representative images from a wound healing assay of U2OS cells stably overexpressing pBabe FBXL13 or an empty vector control (VEC). Cells were transduced with either a lentiviral vector containing an shRNA targeting FBXL13 or a control shRNA. The wound edge is shown in white. Scale bar, 250 μm.
Quantification of wound closure efficiency in (D) (mean ± SD from three independent experiments, n > 4 wounds per condition).
Validation of FBXL13 mRNA level in the samples shown in (D) using quantitative real‐time PCR (qPCR) (mean ± SD from three qPCR triplicates).
References
Publication types
MeSH terms
Substances
Grants and funding
LinkOut - more resources
Full Text Sources
Other Literature Sources
Molecular Biology Databases
