. 2018 Feb 21;38(8):1942-1958.
doi: 10.1523/JNEUROSCI.2021-17.2017. Epub 2018 Jan 18.

Multimodal Encoding of Novelty, Reward, and Learning in the Primate Nucleus Basalis of Meynert

Affiliations

Multimodal Encoding of Novelty, Reward, and Learning in the Primate Nucleus Basalis of Meynert

Clarissa Martinez-Rubio et al. J Neurosci. .

Abstract

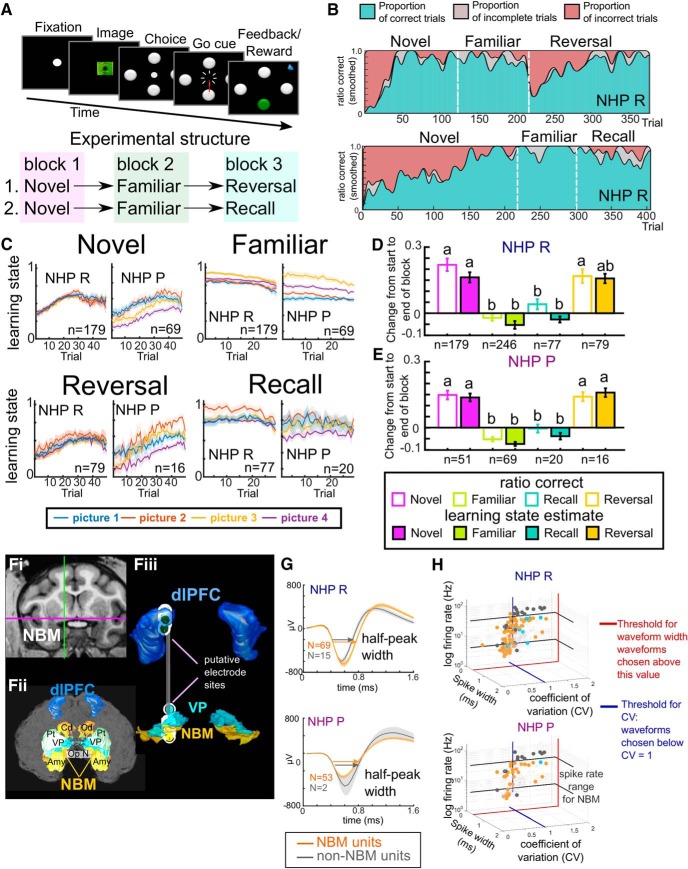
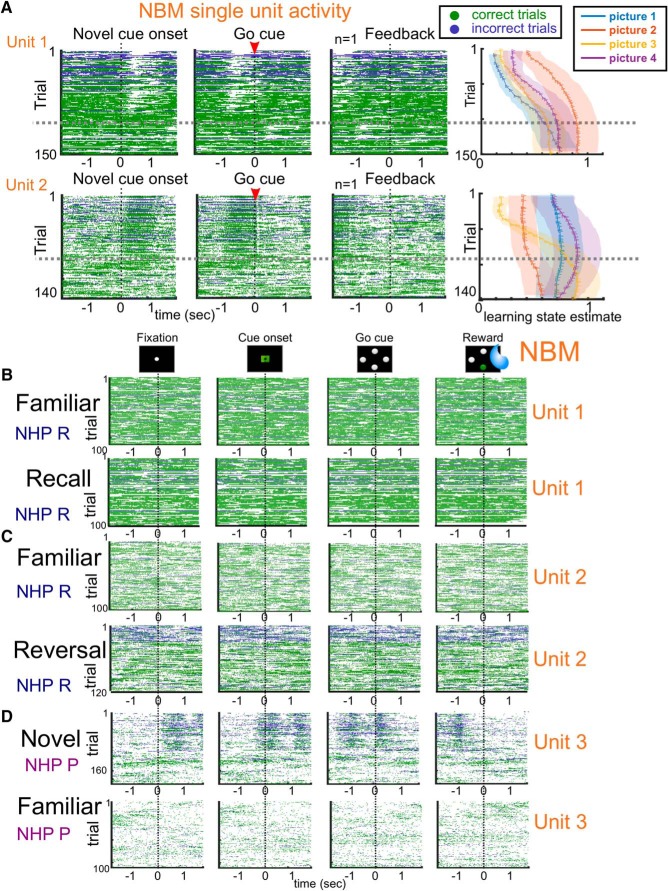
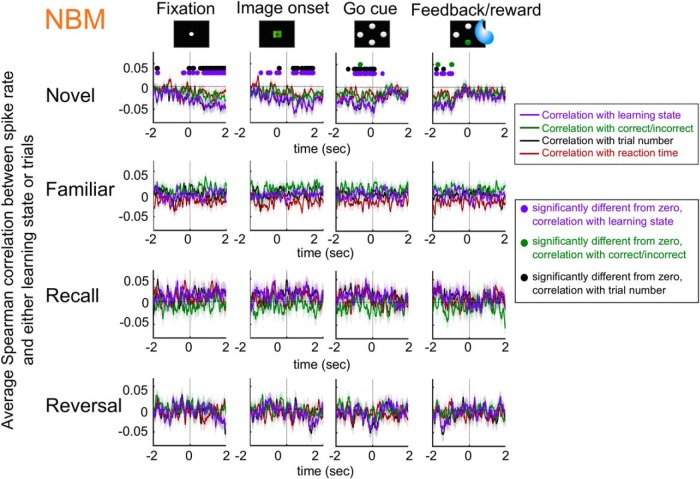
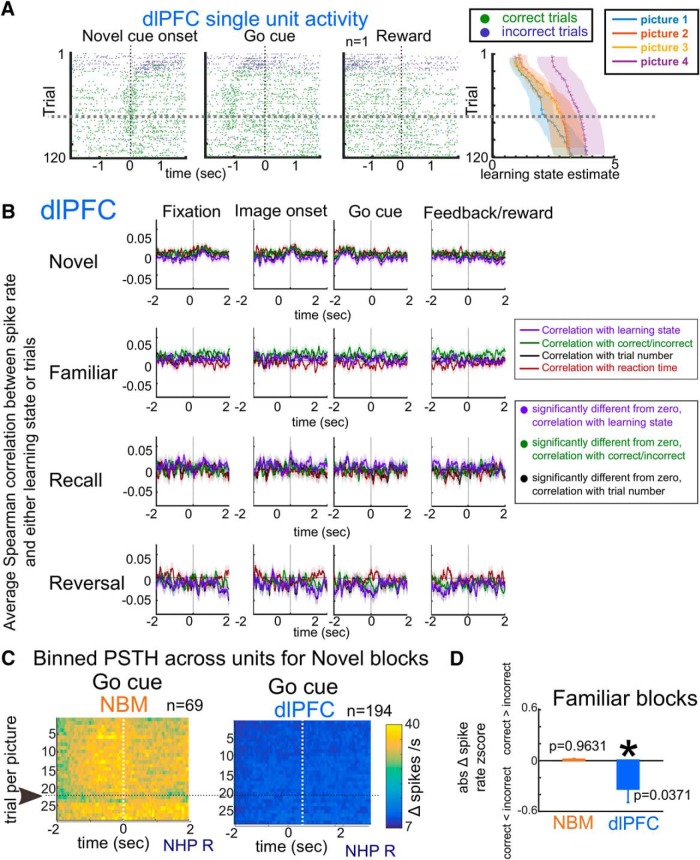
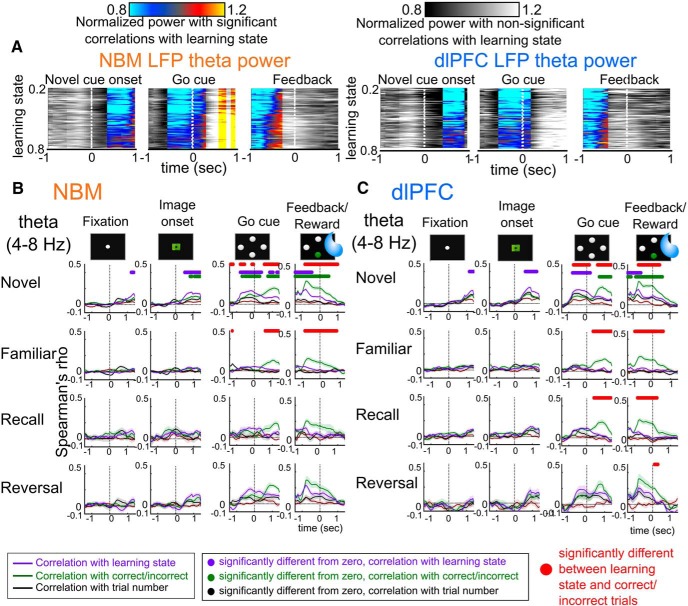
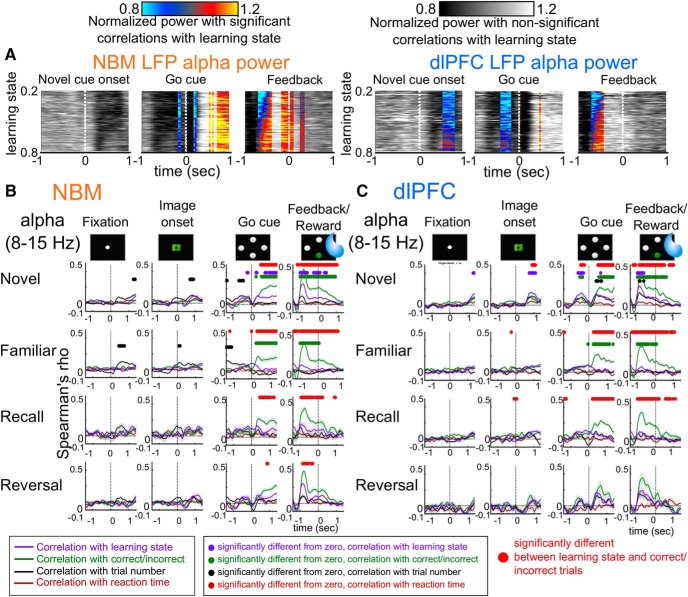
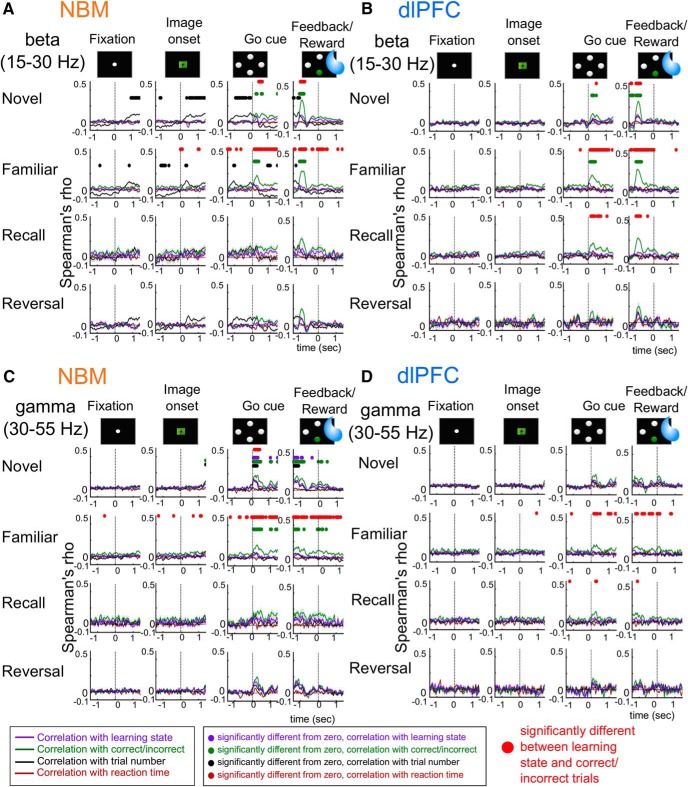
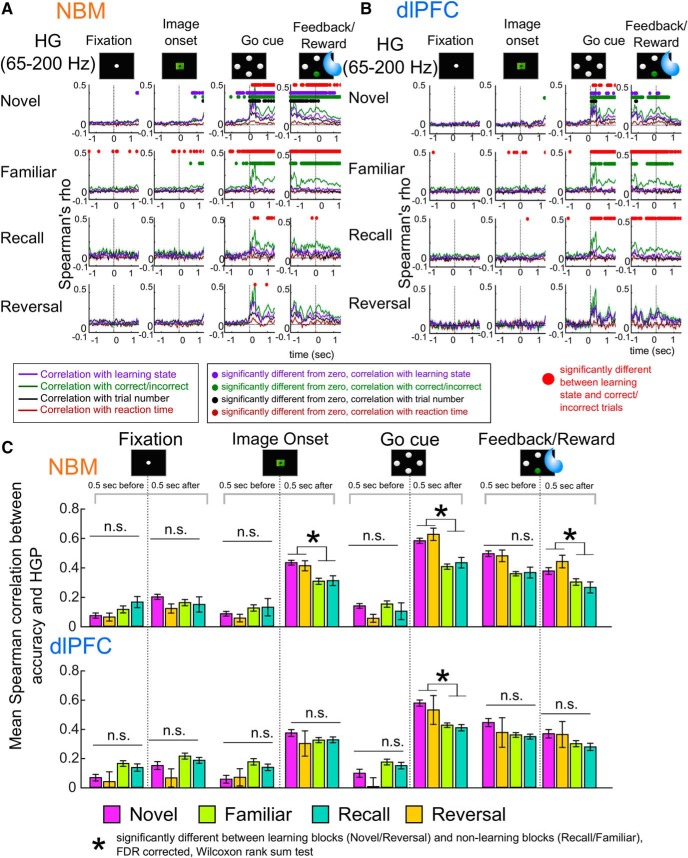
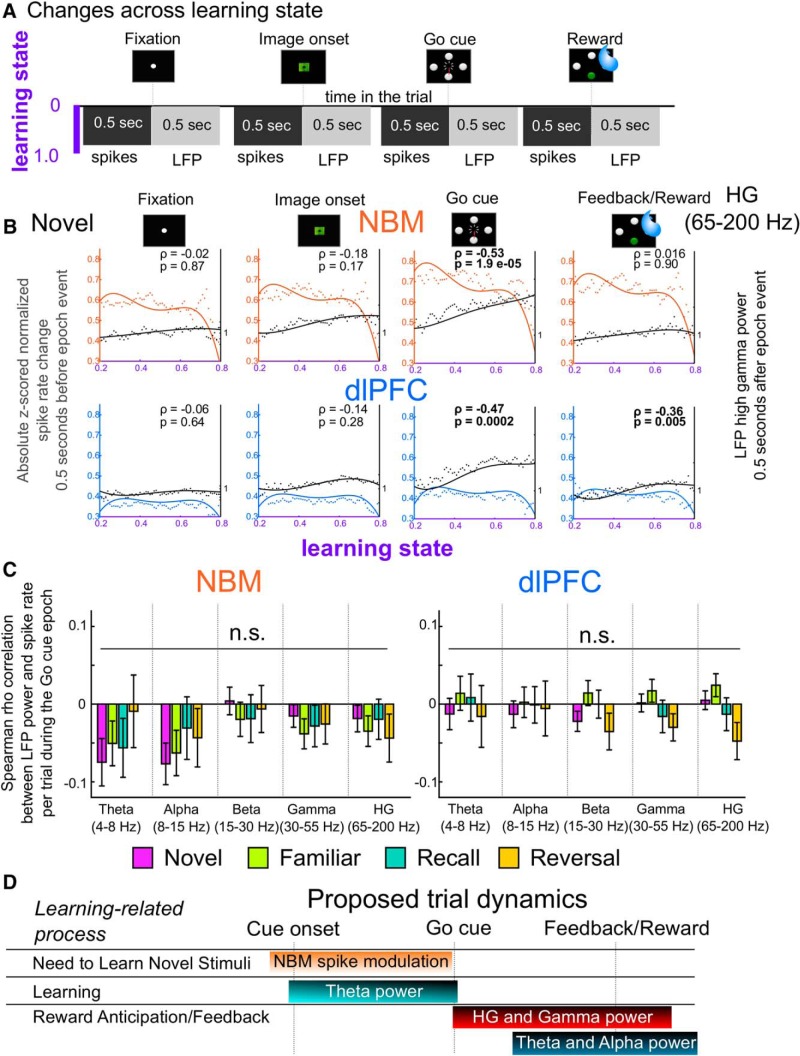
Associative learning is crucial for daily function, involving a complex network of brain regions. One region, the nucleus basalis of Meynert (NBM), is a highly interconnected, largely cholinergic structure implicated in multiple aspects of learning. We show that single neurons in the NBM of nonhuman primates (NHPs; n = 2 males; Macaca mulatta) encode learning a new association through spike rate modulation. However, the power of low-frequency local field potential (LFP) oscillations decreases in response to novel, not-yet-learned stimuli but then increase as learning progresses. Both NBM and the dorsolateral prefrontal cortex encode confidence in novel associations by increasing low- and high-frequency LFP power in anticipation of expected rewards. Finally, NBM high-frequency power dynamics are anticorrelated with spike rate modulations. Therefore, novelty, learning, and reward anticipation are separately encoded through differentiable NBM signals. By signaling both the need to learn and confidence in newly acquired associations, NBM may play a key role in coordinating cortical activity throughout the learning process.SIGNIFICANCE STATEMENT Degradation of cells in a key brain region, the nucleus basalis of Meynert (NBM), correlates with Alzheimer's disease and Parkinson's disease progression. To better understand the role of this brain structure in learning and memory, we examined neural activity in the NBM in behaving nonhuman primates while they performed a learning and memory task. We found that single neurons in NBM encoded both salience and an early learning, or cognitive state, whereas populations of neurons in the NBM and prefrontal cortex encode learned state and reward anticipation. The NBM may thus encode multiple stages of learning. These multimodal signals might be leveraged in future studies to develop neural stimulation to facilitate different stages of learning and memory.

Keywords: encoding cognitive state; learning; local field potential; nucleus basalis of Meynert; single neuron activity.


Figures

Figure 1.
Figure 1.
NHPs learn and reverse associations and can do so while recalling already established associations. A, Experimental paradigm. During an associative learning task, adult rhesus macaques associated a visual image with one of four target locations. Once the animals indicated a choice by an eye movement, the target changed color to either green or red corresponding with a correct or incorrect choice, respectively (see Materials and Methods). Each experimental session involved three blocks of 140.3 ± 51.08 trials (Novel), 95.4 ± 15.98 trials (Familiar), and either Reversal (142.4 ± 47.50 trials) or Recall (103.7 ± 27.56 trials) of associations learned in the same sessions' Novel blocks (average trial numbers across both NHPs). B, Representative example of learning behavior for a Novel/Familiar/Reversal experiment (top) and a Novel/Familiar/Recall experiment (bottom) in R. Curves are the ratio correct in a sliding five-trial window smoothed by a 10-trial noncausal Gaussian kernel. Performance increases gradually from low levels when learning new associations (Novel, Reversal) and is consistently high when performing learned associations (Familiar, Recall). C, Average learning state curves for both NHPs across Novel, Familiar, Reversal, and Recall experiments. n indicates the number of blocks run per NHP and experimental condition. D, E, evidence of learning in R and P. We compared ratio-correct (D) and learning state (E), averaged across each block's four target images, between the first 50 and final 50 trials of each block. In both animals and using either metric, there is significantly greater learning (increase from block start to block end) during Novel and Reversal blocks compared with the Recall and Familiar blocks, in which animals perform already-learned associations. Letters “a” and “b” above bars indicate statistically separable groups by Tukey post hoc testing after Kruskal–Wallis test. D, R: χ2 = 161.71, p < 0.000001. E, P: χ2 = 215.7, p < 0.000001. Error bars indicate SEM. FiFiii, T1-weighted MRI with fiducial markers showing electrode trajectories for the NBM and the dlPFC with 3D reconstructions of neighboring brain structures. We use anatomical mapping to additionally separate VP from NBM recordings by reconstructing the areas of the VP and NBM on the MRI and dividing recordings based on the amount of overlap between the electrode tip and the 3D reconstructed structures (see Materials and Methods). Cd, Caudate; Pt, putamen; Ac, anterior commissure; Op N, optic nerve; Amy, amygdala. G, Average waveform shape of units classified as NBM or non-NBM (only including recordings which mapped in 3D to the NBM region) illustrating differences in peak width. Shaded regions indicate SEM. H, The three criteria per unit and the classification of the units into NBM and non-NBM. The latter were not used for further analysis.
Figure 2.
Figure 2.
NBM neurons modulate firing specifically in response to novel cues. A, Representative example of two NBM neurons collected on different days from R. Unit 1 suppressed firing immediately after stimulus presentation, returning to baseline firing at the Go cue. Unit 2's activity increased during the same period and normalized at the Go cue. This modulation lasted for the first 100 trials of the novel block, after which the spike rate showed less perievent variability (dashed horizontal line). This was particularly visible after the animal learned the association, as represented in the learning state estimate to the right. Similarly, during Familiar (B, top) and Recall (B, bottom) blocks, again containing only well learned associations, Unit 1 from A maintains a constant firing rate. Unit 2, also shown in A (bottom), further demonstrates that novel associations alone are not sufficient to produce NBM modulation. This unit also does not modulate to task cues during the Familiar (C, top) block. Even during Reversal (C, bottom), when non-novel stimuli are paired with new associations, task cues do not change this unit's firing rate. C (bottom) also illustrates that correct/incorrect performance on any given trial does not drive firing rate. D, After the Fixation cue of Novel blocks, when as-yet-unlearned images are presented, this unit from P increases its firing rate. As the associations are learned (increasing trial number), this modulation ceases, as evident after trial 100 in this plot. During a Familiar block in which stimuli are salient but associations are well known, this same unit does not modulate to task cues. Compare these responses with those shown in AC, which is the same pattern in units from R.
Figure 3.
Figure 3.
NBM unit modulation is specific to Novel blocks. Mean Spearman rank correlations between z-scored spike rate changes (relative to baseline activity 1 s before fixation) and trial-level variables using a sliding 50 ms window. Only Novel blocks showed median correlations significantly different from zero, as indicated by circles above the curves (Wilcoxon signed-rank test on the distribution of Spearman coefficients at each time bin, thresholded to FDR correction through time to p < 0.05, Bonferroni corrected for testing of multiple epochs). Both trial number and learning state correlated with spike rate modulation, suggesting that novelty of the stimulus drives modulation. n indicates the number of units per experiment in the NBM (orange). Shaded regions around lines indicate SEM. Curves show correlations between z-scored spike rate change from baseline and learning (purple), trial number (black), accuracy (green), or reaction time (burgundy). Columns are the different epochs of the task. Rows are the different types of blocks in the task. The Recall and Reversal blocks have fewer neurons due to loss of isolation on some cells during the final block of a session as well as experimental design (see Materials and Methods). In the Novel blocks, NBM firing modulating was significantly correlated to both learning and trial number, both of which are measures of stimulus novelty. No such encoding is present for any other block. Data are from 112 NBM units across two NHPs. Shaded regions around lines indicate SEM.
Figure 4.
Figure 4.
In contrast to NBM, dlPFC neurons do not respond strongly to stimulus novelty or unlearned associations. A, Example raster plots of a dlPFC unit (R). The unit did not show substantial cue-related modulation and this did not change as the learning state increased. This is further evident from B, which shows that dlPFC units did not demonstrate any significant correlations between learning state and spike rate changes for the same time windows. Mean Spearman rank correlations between z-scored spike rate changes (relative to baseline activity 1 s before fixation) and trial-level variables using a sliding 5 ms window are shown. n indicates the number of units per experiment in the dlPFC (blue). In the Novel blocks, dlPFC modulation was not significantly correlated to both learning and trial number, both of which are measures of stimulus novelty. Data are from 210 dlPFC units across two NHPs. Shaded regions around lines indicate SEM. C, Contrast between dlPFC and NBM activity is further illustrated in binned peristimulus time histograms (PSTHs) in the two regions. We took all units recorded during Novel blocks in R and averaged their firing around the time of the Go cue, normalizing and z-scoring activity as per Materials and Methods. When averaging peristimulus activity at the level of the individual picture, NBM neurons as a population show substantial modulation (absolute value of firing rate change vs pretrial baseline) just before the Go cue. As per Figure 2, this modulation diminishes with learning, seen here at approximately trial 20 (black arrow and dotted line). dlPFC neurons as a group do not show this modulation. D, Changes in spike rate with error and correct/incorrect. dlPFC neurons encoded error, especially unexpected error, more strongly than NBM. In the Familiar block, when animals had a high degree of confidence in their responses, dlPFC neurons had significantly higher (p = 0.0371; Wilcoxon signed-rank test) firing rates immediately after Feedback in incorrect trials compared with correct. No such difference was found in NBM firing rates (p = 0.9631; Wilcoxon signed-rank test). Error bars indicate SEM.
Figure 5.
Figure 5.
Low-frequency (theta-band) LFP power encodes both learning and reward expectation in NBM and dlPFC. A, Average changes in theta power from baseline across recordings and animals across learning states in the NBM (n = 44 recordings across two animals; left) and dlPFC (n = 49 recordings across two animals; right) for Novel blocks. Color versus gray designates 50 ms windows in which the correlation between theta power and learning state values is or is not significant, respectively, after FDR correction. For plotting, the learning state was binned from 0 to 1 in increments of 0.005 and trials were assigned to their nearest bin. This binning was not used for the statistical calculation. In both structures, theta power decreased after image presentation and returned to baseline just after the Go cue early in the learning process. This modulation dissipated as the animals learned. B, C, Spearman rank correlations among theta LFP power and learning state (purple), choice accuracy (green), and trial number (black). Red markers indicate points where the learning state and accuracy correlations are significantly different (p < 0.05, Bonferroni corrected for epoch and frequency band comparisons and FDR corrected through time, Wilcoxon rank-sum test). Other color markers indicate whether the mean correlation at each time point was significantly different from zero (p < 0.05, Bonferroni corrected for frequency bands and epochs and FDR corrected through time, Wilcoxon signed-rank test). The learning state was significantly correlated to theta power (and more strongly correlated than accuracy) from ∼700 ms before the Go cue (purple arrowheads) until just after Go cue in both NBM (B) and dlPFC (C), Accuracy was significantly correlated with theta power in the Feedback-locked analysis (green arrowheads) and this correlation exceeded the correlation with learning state both before and after Feedback. B, C, Shaded regions around lines indicate SEM.
Figure 6.
Figure 6.
Low-frequency (alpha) LFP encoding of learning, but not reward anticipation, is specific to Novel blocks. A, Same metric and statistical approaches as in Figure 5A, but in the alpha (8–15 Hz) band. B, C, Same metrics and statistical approaches as in Figure 5, B and C, but in the alpha band in the NBM (B) and dlPFC (C). Post-image suppression was less prominent and the post-Go cue enhancement in NBM was stronger than the dlPFC. Alpha power generally encoded accuracy more strongly than it encoded learning and significant encoding was present as early as 1 s before Feedback. This was consistent with a reward anticipation signal. B, C, Shaded regions around lines indicate SEM. Data include NBM: n = 44 recordings (sessions) across two animals and dlPFC: n = 49 recordings (sessions) across two animals. Line and color markers follow the same schema as Figure 5, B and C. Shaded regions around lines indicate SEM.
Figure 7.
Figure 7.
LFP power in beta (A, B) and gamma (C, D) bands does not encode learning processes. Correlations between LFP power and trial-level variables (learning state, accuracy, trial number, and reaction time) are plotted and statistically evaluated as in same metrics and statistical approaches as in Figure 5, B and C. Beta-band (15–30 Hz) correlation curves are plotted for the NBM (A) and dlPFC (B). Gamma-band (30–55 Hz) correlation curves are plotted for the NBM (C) and dlPFC (D). There are few time points where power is significantly correlated with the learning state to a smaller extent than in lower frequencies. Power correlations to learning state are always smaller than power correlations to accuracy (reward/anticipation). Data include NBM: n = 44 recordings (sessions) across two animals and dlPFC: n = 49 recordings (sessions) across two animals. Line and color markers follow the same schema as Figure 5, B and C. Shaded regions around lines indicate SEM.
Figure 8.
Figure 8.
HGP in the NBM encodes reward expectation, leading to an anticorrelation between spike and HGP modulation during learning. A, B, HGP (65–200 Hz) modulation is correlated with trial accuracy more strongly than with learning, although both show significant correlations just after the Go cue. This correlation between learning and HGP is present during novel learning such as Novel blocks, but not in Familiar blocks. Accuracy (which correlates with anticipated reward) showed significant correlations with HGP in both structures, continuing after Feedback when the reward was being consumed. This encoding reached statistical significance for most of the peri-feedback period in Novel and Familiar blocks in dlPFC and the NBM and was qualitatively present in Recall and Reversal blocks. Correlations between LFP power and trial-level variables (learning state, accuracy, trial number, and reaction time) are plotted and statistically evaluated as in same metrics and statistical approaches as in Figure 5, B and C. NBM (n = 44 recordings across two animals). C, These correlations are present in the dlPFC, though with fewer significant points than in the NBM (n = 49 recordings across two animals). Line and color markers follow the same schema as Figure 5, B and C. This encoding is also present before and after Feedback, implying that it represents both reward anticipation and consumption. Shaded regions around lines indicate SEM. C, Reward encoding in the perievent HGP modulation was also stronger during active learning. After the Go cue, in blocks that involve new learning (Novel/Reversal), the mean correlation between HGP and choice accuracy was larger than this same correlation in Familiar/Recall blocks without learning (p < 0.00013, Wilcoxon rank-sum test with FDR correction for testing across frequency bands, block types, epochs, and regions). Error bars represent SEM.
Figure 9.
Figure 9.
HGP is anticorrelated with spike activity modulation during learning. A, Analysis schematic for the correlation of spike rate and LFP modulation with learning state. The learning state was binned into ascending steps of 0.01 in each block (purple arrow). We then took the mean of spike rate modulation (dark gray boxes) or HGP (light gray boxes) during 0.5 s windows on each trial of that block. Each window was time locked to a specific event within the trial. We interpolated those mean values to the learning state bins, creating a standardized time course of event-locked neural modulation as a function of learning within a block. The learning state was binned into ascending steps of 0.01 in each block. We then took the mean of spike rate modulation (blue/orange) or HGP (black) during 0.5 s windows on each trial of that block. We interpolated those mean values to the learning state bins, creating a standardized time course of neural modulation relative to learning within a block. B, During Novel blocks, spike rate modulation around the Go cue is anticorrelated with HGP modulation around the same cue in both NBM (orange) and dlPFC (blue), as well as around the Reward/Feedback event in dlPFC. Points represent the mean modulation at each step of the learning state, whereas curves are a cubic spline fit to those points. Inset ρ and p-values are Spearman correlations and p-values between the interpolated spike and HGP modulation time courses. C, Correlation values between spike rate and LFP power for five frequency bands on a per trial basis for the different experiment types during the Go cue epoch. No mean Spearman correlation values were significantly different from zero (p < 0.0013, FDR controlled, Wilcoxon signed-rank test). In addition, the mean Spearman correlation values were not significantly different from one another (NBM: χ2 = 16.91; p = 0.596, dlPFC: χ2 = 16.03; p = 0.655; Kruskal–Wallis test). D, Summary model of multimodal neural encoding of learning in NBM and dlPFC as aligned to trial events. NBM spike rates modulate during early learning, as does theta power, and both types of modulation diminish as learning proceeds. Theta, alpha, gamma, and HGP encode reward anticipation. Each of these LFP power bands shows significant correlation with trial accuracy even before the decision has been evaluated, suggesting that they encode the animal's confidence in its response. Both also continue to show that correlation after reward consumption.

Similar articles

Cited by

References

    1. Asaad WF, Eskandar EN (2008) A flexible software tool for temporally-precise behavioral control in Matlab. J Neurosci Methods 174:245–258. 10.1016/j.jneumeth.2008.07.014 - DOI - PMC - PubMed
    1. Asaad WF, Eskandar EN (2011) Encoding of both positive and negative reward prediction errors by neurons of the primate lateral prefrontal cortex and caudate nucleus. J Neurosci 31:17772–17787. 10.1523/JNEUROSCI.3793-11.2011 - DOI - PMC - PubMed
    1. Bakin JS, Weinberger NM (1996) Induction of a physiological memory in the cerebral cortex by stimulation of the nucleus basalis. Proc Natl Acad Sci U S A 93:11219–11224. 10.1073/pnas.93.20.11219 - DOI - PMC - PubMed
    1. Bakker R, Tiesinga P, Kötter R (2015) The scalable brain atlas: instant web-based access to public brain atlases and related content. Neuroinformatics 13:353–366. 10.1007/s12021-014-9258-x - DOI - PMC - PubMed
    1. Barefoot HC, Baker HF, Ridley RM (2002) Crossed unilateral lesions of temporal lobe structures and cholinergic cell bodies impair visual conditional and object discrimination learning in monkeys. Eur J Neurosci 15:507–516. 10.1046/j.0953-816x.2001.01888.x - DOI - PubMed

Publication types

LinkOut - more resources