PlexinD1 signaling controls morphological changes and migration termination in newborn neurons
- PMID: 29348324
- PMCID: PMC5813262
- DOI: 10.15252/embj.201797404
PlexinD1 signaling controls morphological changes and migration termination in newborn neurons
Abstract
Newborn neurons maintain a very simple, bipolar shape, while they migrate from their birthplace toward their destinations in the brain, where they differentiate into mature neurons with complex dendritic morphologies. Here, we report a mechanism by which the termination of neuronal migration is maintained in the postnatal olfactory bulb (OB). During neuronal deceleration in the OB, newborn neurons transiently extend a protrusion from the proximal part of their leading process in the resting phase, which we refer to as a filopodium-like lateral protrusion (FLP). The FLP formation is induced by PlexinD1 downregulation and local Rac1 activation, which coincide with microtubule reorganization and the pausing of somal translocation. The somal translocation of resting neurons is suppressed by microtubule polymerization within the FLP The timing of neuronal migration termination, controlled by Sema3E-PlexinD1-Rac1 signaling, influences the final positioning, dendritic patterns, and functions of the neurons in the OB These results suggest that PlexinD1 signaling controls FLP formation and the termination of neuronal migration through a precise control of microtubule dynamics.
Keywords: microtubule; neuronal migration; olfactory bulb; photoactivation; postnatal neurogenesis.
© 2018 The Authors.
Figures

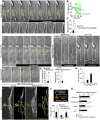
- A
Time‐lapse images of a tdTomato‐labeled GC migrating in an OB slice.
- B
Distribution of protrusion lengths (229 events, 24 cells). Gray and black lines indicate fitted curves for short and long protrusions, respectively. FLPs, green.
- C
Cellular location of protrusions (24 cells).
- D
Protrusion formation in the resting and migratory phases (24 cells, ***P < 0.005, paired t‐test).
- E
Duration of the resting phase (24 cells, *P < 0.05, paired t‐test).
- F, G
Time‐lapse images of a cultured migrating neuron expressing EGFP‐UtrCH (green) and DsRed (red) (F) and FLP frequency (G) (15 cells, **P < 0.01, one‐way ANOVA followed by Tukey–Kramer test).
- H, H'
Representative image of an FLP‐bearing cultured neuron stained with phalloidin (green) and an α‐tubulin (red) antibody. Magnified images of the boxed area in (H) are shown in (H').
- I, I'
Representative images of a cultured neuron with or without an FLP, stained with anti‐tyrosinated (Tyr, green) and anti‐acetylated (Ac, magenta) tubulin antibodies. Magnified images of the boxed areas in (I) are shown in (I'). White arrowheads, loosened tubulin bundles.
- J
Classification of EB3‐GFP+ (a marker of MT plus‐ends) trajectories.
- K
EB3‐GFP+ trajectories (white and orange arrows). Orange arrows indicate “traversing” trajectories classified in (J). Magnified image of the boxed area in (K) is shown in (K'). Green arrowheads indicate swelling.
- L, M
Proportion of EB3‐GFP+ trajectory directions in the distal (L) and proximal (M) leading process. ***P < 0.005 [vs. FLP(−)], one‐way ANOVA followed by Tukey–Kramer test. Parentheses, number of cells.
- N
EB3‐GFP speed. *P < 0.05, **P < 0.01, ***P < 0.005 (vs. FLP(−) [no swelling]), § P < 0.05, §§§ P < 0.005 (vs. FLP(−) [swelling]), ## P < 0.0005 (vs. FLP(+)‐Distal LP), one‐way ANOVA followed by Tukey–Kramer test. Parentheses, number of events.
- O, P
Transmission electron microscopy images of the proximal leading process of a migrating neuron without (O) or with (P) an FLP. Red, blue, and green indicate cell membrane, microtubules, and centrioles, respectively.
- Q–R''
SBF‐SEM images (Q) and their 3D reconstruction (R–R'') of an FLP‐bearing neuron (green). Arrows, mitochondria (Q). Red indicates the region of contact between the FLP and GCs (R'').

Experimental scheme.
Typical morphology of a transplanted cell with an FLP (arrow) observed in the GCL 8 days post‐transplantation (dpt).
Proportion of swelling‐bearing cells with a leading process with or without an FLP from GC‐rich (three mice) and PGC‐rich (three mice) fractions of the GCL at 8 dpt.
Proportion of swelling‐bearing cells with a leading process with or without an FLP from PGC‐rich fractions of the EPL and GL at 8 (three mice) and 14 (seven mice) dpt.
Anti‐GFP (green) and Hoechst 33342 (blue, nuclei) staining of OB sections at 14 dpt.
Proportion of neurons in the OB layers from GC‐rich (seven mice) and PGC‐rich (seven mice) fractions at 14 dpt.

Coronal section of the OB in WT mice stained for PlexinD1 (red) and Dcx (green).
Relative expression level of PlexinD1 in Dcx+ cells (GCL, n = 138 cells from three mice; EPL, n = 36 cells from three mice; ***P < 0.005, Mann–Whitney U‐test). Bars indicate mean ± SEM.
Coronal sections of the OB in Sema3E +/GFP mice stained for GFP (green), NeuN (red), and Dcx (blue).

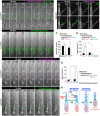
- A
Time‐lapse images of a tdTomato‐labeled PlexinD1‐overexpressing neuron migrating in the OB.
- B
Effect of PlexinD1 overexpression on the FLP‐formation frequency and neuronal migration speed in the GCL. FLP formation, n = 78 (Control), 45 (PlexinD1) cells, ***P < 0.005, unpaired t‐test; Speed, n = 114 (Control), 58 (PlexinD1) cells, ***P < 0.005, Mann–Whitney U‐test.
- C
Time‐lapse images of DsRed‐labeled control and PlexinD1‐KD neurons.
- D
Effect of Sema3E on leading‐process length and FLP‐formation frequency (n = 37, 37, 45, 40 cells; ***P < 0.005, unpaired t‐test).
- E
Effect of Sema3E on neuronal migration in vitro (n = 42, 142, 44, 114 cells; *P < 0.05, unpaired t‐test).
- F
Representative images of Dcx+ neurons (red) expressing EGFP (control) or EGFP‐R‐RasCA (green).
- G
Number of FLPs in control and R‐RasCA‐expressing neurons (n = 319, 345, 178, 231 cells, *P < 0.05, ***P < 0.005, Mann–Whitney U‐test).
- H, H'
Time‐lapse FRET ratiometric images of Rac1 activity (pseudocolors) in a cultured migrating neuron. Magnified images of the boxed areas in (H) are shown in (H').
- I
Activation of Rho GTPases at the leading process before FLP formation [Rac1 (56 events, 10 cells), cdc42 (32 events, 11 cells), RhoA (27 events, 11 cells); ***P < 0.005, ****P < 0.0005, paired t‐test (vs. baseline)].
- J
Correlation between Rac1 activation and FLP‐formation frequency (10 cells, *P < 0.05, Kruskal–Wallis test followed by Steel–Dwass test).
- K
Rac1 activation in the disappearing and stable FLP [disappearing (16 events, 10 cells); stable (54 events, 10 cells); *P < 0.05, ****P < 0.0005, paired t‐test (vs. baseline); disappearing vs. stable, ***P < 0.005, unpaired t‐test].
- L
Effect of Sema3E on Rac1 activation at the leading tip or shaft in control (10 cells) and PlexinD1‐KD (11 cells) neurons [Sema3E(−) vs. (+), ***P < 0.005, paired t‐test; Control vs. PlexinD1‐KD in Sema3E(+), ***P < 0.005, unpaired t‐test].
- M
Time‐lapse FRET ratiometric images of Rac1 activity in a neuron migrating in a cultured OB slice.
- N
Rac1 activation before (pre) and during (FLP) FLP formation [seven events, six cells; *P < 0.05, paired t‐test (vs. baseline)].

- A
Time‐lapse images of PA‐Rac1DN‐associated FLP retraction. Magnified images of the FLP are shown in (A').
- B
FLP length following photoactivation.
- C
Migrating neuron speed (nine cells, ***P < 0.005, paired t‐test).
- D
Time‐lapse images of PA‐Rac1CA‐induced FLP formation. Magnified images of the FLP are shown in (D').
- E
Frequency of PA‐induced FLP formation [n = 3 (28 cells, C450A), 5 (43 cells, PA‐Rac1CA) cultures, ***P < 0.005, unpaired t‐test], and migrating neuron speed (five cells, ***P < 0.005, paired t‐test).
- F, G
Time‐lapse images of PA‐Rac1CA‐induced FLP formation in IQGAP1‐ (F) and p67phox‐ (G) KD neurons.
- H
Frequency of PA‐induced FLP formation [n = 3 (Control, 22 cells), 4 (IQGAP1‐KD, 39 cells), 4 (p67phox‐KD, 42 cells) cultures; **P < 0.01, one‐way ANOVA followed by Dunnett test].
- I
Trajectories (white and orange arrows) of EB3‐mCherry+ MT plus‐ends in a PA‐Rac1DN‐expressing cell. Orange arrows indicate “traversing” trajectories classified in (J). Dotted lines indicate cell membrane (I). Nuc, nucleus.
- J, K
Proportion of EB3‐mCherry+ trajectory directions in the proximal leading process (J; 5 cells; *P < 0.05, **P < 0.01, paired t‐test) and speed of EB3‐mCherry+ MT plus‐ends (K; 5 cells; proximal LP, *P < 0.05, Mann–Whitney U‐test; soma, ***P < 0.005, unpaired t‐test). Parentheses, number of events (K).

- A, B
Time‐lapse images of the inhibition of MT polymerization in the FLP by PST‐1. Circled areas were photostimulated using a 405‐nm (activating) (A) and 514‐nm (deactivating) (B) laser. Rectangular areas were photostimulated using a 514‐nm laser. Magnified images of the FLP in (A) are shown in (A'). (A') Disappearance of EB3‐GFP+ signals (green arrowheads) by PST‐1 activation in the FLP.
- C
Density of EB3‐GFP+ dots (MT plus‐ends) in the proximal leading process and FLP (four cells; *P < 0.05, paired t‐test).
- D
Migrating neuron speed [No laser vs. Photoswitching in 405 nm, *P < 0.05, paired t‐test; 405 nm (five cells) vs. 514 nm (six cells) in Photoswitching, *P < 0.05, unpaired t‐test].
- E, F
Time‐lapse images of the inhibition of somal translocation by PST‐1 after FLP retraction. Circled areas were photostimulated using a 405‐ (E) and 514‐ (F) nm laser.
- G
Migrating neuron speed [405 nm (six cells) vs. 514 nm (five cells) in Photoswitching, *P < 0.05, unpaired t‐test; No laser vs. Photoswitching in 514 nm, *P < 0.05, paired t‐test].
- H
Model.

- A
Schematic illustration of new‐neuron positioning and dendritic patterns in the OB.
- B–D
Proportion of neurons in the OB layers in control (five mice), PlexinD1 (five mice), PlexinD1GAP1RA (six mice), and PlexinD1∆RBD (five mice) groups (B; one‐way ANOVA followed by Tukey–Kramer test), control (seven mice) and Sema3E KO (six mice) mice (C; unpaired t‐test), and control (six mice) and PlexinD1‐cKO (six mice) mice (D; unpaired t‐test) at 10 days postinfection (dpi). *P < 0.05, **P < 0.01, ***P < 0.005.
- E
Traces of neuronal morphologies in control and PlexinD1‐cKO mice at 28 dpi. Arrows, lateral dendrites.
- F
Proportion of neurons, classified by their dendritic patterns, in control (six mice) and PlexinD1‐cKO (five mice) groups. *P < 0.05, unpaired t‐test.
- G
Anti‐GABA (upper panels, green) and NeuN (lower panels, green) staining of OB sections from control and Ad‐Cre; PlexinD1‐cKO mice at 28 dpi. Nuclei were stained with Hoechst 33342 (blue).
- H
Numbers of GABA+ PGCs and NeuN+ GCs in control (six mice) and Ad‐Cre;PlexinD1‐cKO (six mice) mice. *P < 0.05, ***P < 0.005, unpaired t‐test.
- I
Proportions of PGCs and GCs in the OB interneurons (PGCs + GCs) in control (six mice) and Ad‐Cre;PlexinD1‐cKO (six mice) mice. *P < 0.05, unpaired t‐test.
- J
Olfactory habituation and discrimination in control (seven mice) and Ad‐Cre; PlexinD1‐cKO (seven mice) mice. ### P < 0.005 (vs. first session), *P < 0.05, repeated measure ANOVA followed by Bonferroni test. Gray lines represent individual mouse data.
References
-
- Abraham S, Scarcia M, Bagshaw RD, McMahon K, Grant G, Harvey T, Yeo M, Esteves FO, Thygesen HH, Jones PF, Speirs V, Hanby AM, Selby PJ, Lorger M, Dear TN, Pawson T, Marshall CJ, Mavria G (2015) A Rac/Cdc42 exchange factor complex promotes formation of lateral filopodia and blood vessel lumen morphogenesis. Nat Commun 6: 7286 - PMC - PubMed
-
- Anton ES, Ghashghaei HT, Weber JL, McCann C, Fischer TM, Cheung ID, Gassmann M, Messing A, Klein R, Schwab MH, Lloyd KC, Lai C (2004) Receptor tyrosine kinase ErbB4 modulates neuroblast migration and placement in the adult forebrain. Nat Neurosci 7: 1319–1328 - PubMed
-
- Bedard K, Krause KH (2007) The NOX family of ROS‐generating NADPH oxidases: physiology and pathophysiology. Physiol Rev 87: 245–313 - PubMed
-
- Belvindrah R, Natarajan K, Shabajee P, Bruel‐Jungerman E, Bernard J, Goutierre M, Moutkine I, Jaglin XH, Savariradjane M, Irinopoulou T, Poncer JC, Janke C, Francis F (2017) Mutation of the alpha‐tubulin Tuba1a leads to straighter microtubules and perturbs neuronal migration. J Cell Biol 216: 2443–2461 - PMC - PubMed
Publication types
MeSH terms
Substances
Grants and funding
LinkOut - more resources
Full Text Sources
Other Literature Sources
Molecular Biology Databases
Research Materials
Miscellaneous

