. 2018 Feb 9;359(6376):eaao6135.
doi: 10.1126/science.aao6135. Epub 2018 Jan 18.

A pathway for mitotic chromosome formation

Affiliations

A pathway for mitotic chromosome formation

Johan H Gibcus et al. Science. .

Abstract

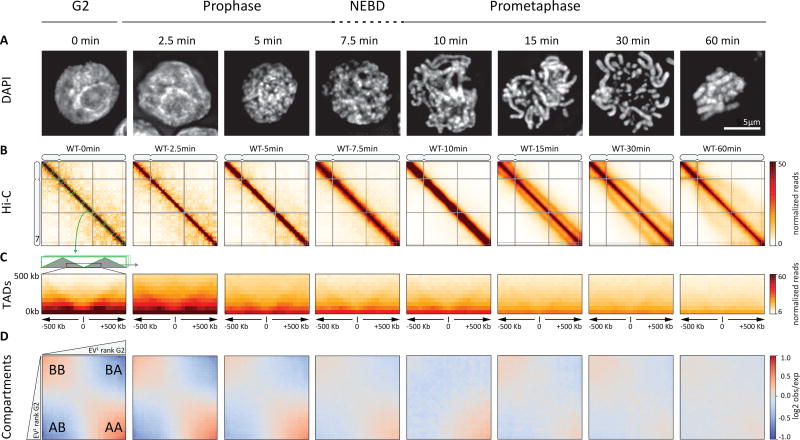
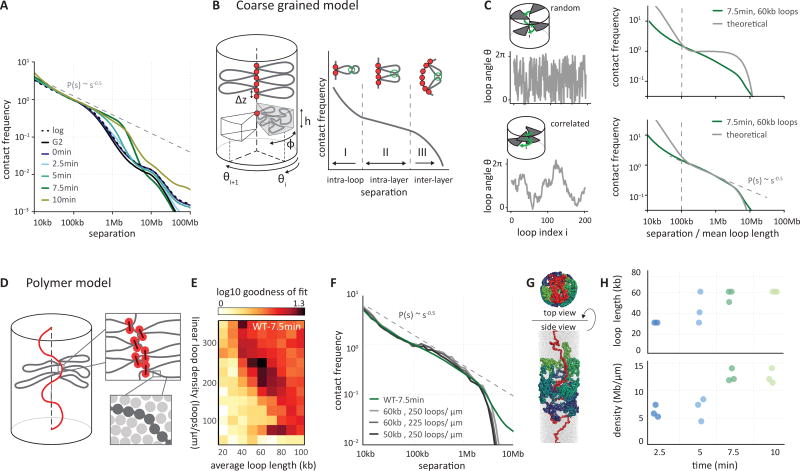
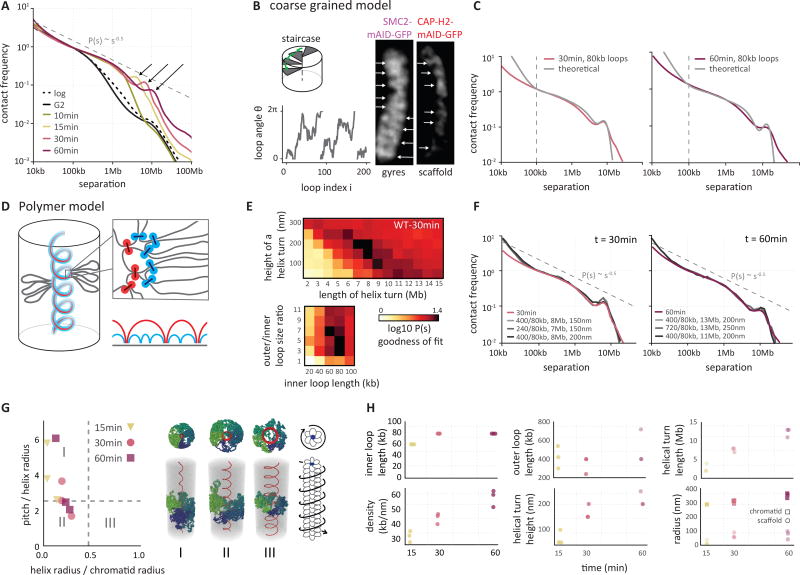
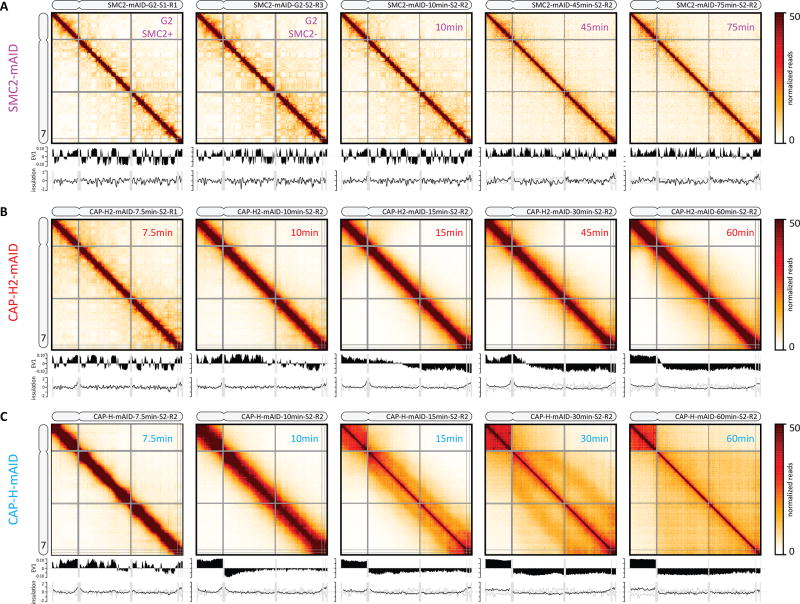
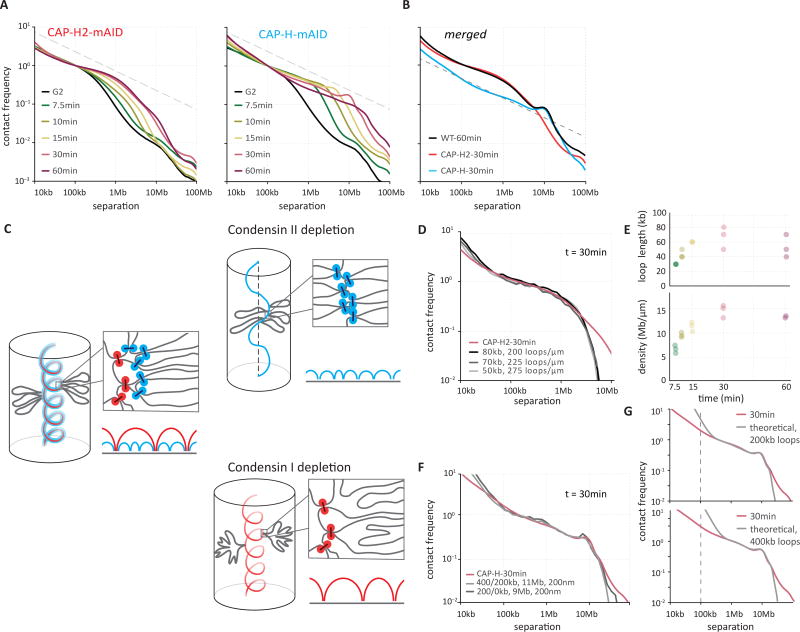
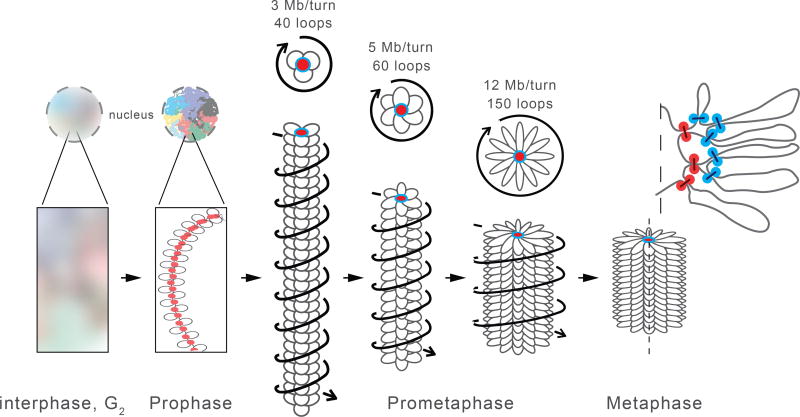
Mitotic chromosomes fold as compact arrays of chromatin loops. To identify the pathway of mitotic chromosome formation, we combined imaging and Hi-C analysis of synchronous DT40 cell cultures with polymer simulations. Here we show that in prophase, the interphase organization is rapidly lost in a condensin-dependent manner, and arrays of consecutive 60-kilobase (kb) loops are formed. During prometaphase, ~80-kb inner loops are nested within ~400-kb outer loops. The loop array acquires a helical arrangement with consecutive loops emanating from a central "spiral staircase" condensin scaffold. The size of helical turns progressively increases to ~12 megabases during prometaphase. Acute depletion of condensin I or II shows that nested loops form by differential action of the two condensins, whereas condensin II is required for helical winding.


Figures

Fig. 1
Fig. 1. Chromosome morphogenesis during synchronous mitosis
(A) Representative DAPI images of nuclei and chromosomes in CDK1as DT40 cells taken at indicated time points (in minutes) after release from 1NM-PP1-induced G2 arrest show mitotic chromosome formation. Bar indicates 5 micron. (B) Hi-C interaction maps of chromosome 7 (binned at 100 kb) from cells collected indicated time points in prophase and prometaphase show large-scale changes in contact frequencies as cell progress through mitosis (C) The average interaction maps center around G2 TAD boundaries. TAD boundaries disappear. (D) Compartmentalization saddle plots: average distance-normalized interaction frequencies between cis-pairs of 100-kb bins arranged by their G2 eigenvector value. Compartments disappear.
Fig. 2
Fig. 2. Prophase chromosomes fold as axially compressed loop arrays
(A) Genome-wide curves of contact frequency P(s) vs genomic distance s, normalized to unity at s=100 kb. The curves are derived from prophase Hi-C data at the indicated time points after release from G2 arrest. The dotted line indicates P(s) = s−0.5 observed for mitotic chromosomes (8). (B) Overview of the coarse grained model of prophase chromosomes. The chromosome is compacted into a series of consecutive loops and compressed into a cylindrical shape. The loop bases form a scaffold at the chromosomal axis, each loop occupies a cylindrical sector of height h and angular size φ, oriented at angle ϴi. The coarse-grained model predicts the P(s) curve to have three distinct regions: an intra loop (I), intra layer (II) and inter layer (III) regions. (C) The best fitting P(s) predictions by the coarse grained model for late prophase (t = 7.5 minutes) under two different assumptions on loop orientations: (top panels) uncorrelated and (bottom panels) correlated orientations of consecutive loops. Uncorrelated angular loop orientations lead to a plateau in P(s) in the intra-layer, whereas correlated angles lead to the experimentally observed P(s) = s−0.5 (right panels). (D) Polymer models of prophase chromosomes. Chromatin fibers are modeled as chains of particles (dark grey circles), compacted into arrays of consecutive loops (loop bases indicated in orange). Chromosomes are compacted into a cylinder with a density of one nucleosome per 11×11×11nm cube (lower right). (E) Goodness of fit for simulated vs experimental P(s). Polymer simulations were performed for a range of loop densities and loop lengths, and for each simulation P(s) was calculated. The heatmap shows the quality of a match between the predicted and experimental P(s) curves at late prophase (t = 7.5 minutes). (F) P(s) derived from late prophase Hi-C experiments (green line) and the best fitting polymer models (grayscale lines). Average loop size and linear density of loops along the chromosome axis are listed.. (G) Top and side view of the best fitting polymer model of late prophase chromosomes. Loops bases are shown in red and several loops rendered in different colors. (H) The average loop size and linear density of the 3 best-fitting models of prophase chromosomes at different time points.
Fig. 3
Fig. 3. Helical organization of prometaphase chromosomes
(A) Genome-wide curves of contact frequency P(s) vs genomic distance (separation, s), normalized to unity at s=100 kb. The curves are derived from Hi-C data obtained from prometaphase cells (t = 10–60 minutes after release from G2 arrest). The dashed line indicates P(s) = s−0.5. Arrows indicate positions of a local peak in P(s) representing the second diagonal band observed in Hi-C interaction maps. (B) The coarse grained model of prometaphase chromosomes with staircase loop arrangement. Left, top: the staircase loop arrangement implies that loops rotate in genomic order around a central scaffold (see Supplemental Materials). Left, bottom: angles of adjacent loops are correlated and steadily increasing, reflecting helical arrangement of loops. Right: this helical arrangement can be observed as gyres by DNA staining and a helical scaffold can be observed in cells expressing GFP-tagged condensins. (C) The best fitting P(s) predictions by the staircase coarse grained model for late prometaphase t = 30 minutes (30min; left panel) and t = 60 minutes (60min, right panel) after release from G2 arrest (Hi-C data: colored lines; model; gray lines). (D) Polymer model of prometaphase chromosomes. Chromosomes are modeled as arrays of consecutive nested loops with a helical scaffold (outer loops in red, inner loops in blue, also indicated diagrammatically bottom right). (E) Goodness of fit for simulated vs experimental P(s). Polymer simulations were performed varying the helix height (nm), the size of a helical turn (Mb), and the sizes of inner and outer loops. For each simulation P(s) was calculated. The heatmaps show the quality of the best match between the predicted and experimental P(s) at prometaphase (t = 30 minutes), when two out of four parameters were fixed to the specified values. (F) P(s) derived from prometaphase Hi-C experiments (colored lines) and the best fitting polymer models (gray lines). Left panel: t = 30 minutes, right panel t = 60 minutes after release from G2 arrest. Average size of outer and inner loops, the length of a helix turn and the helical pitch are indicated. (G) Parameters of the helical scaffolds from the best fitting polymer models. X-axis: ratio of the radius of the helical scaffold to that of the whole chromatid; Y-axis: ratio of the pitch to the helix radius. The dashed lines show the corresponding values (0.46 and 2.5122) for the optimal space-filling helix (84). Classical solenoid configurations are predicted to be in sector III, while the “spiraling staircase” configurations are in I and II. On the right, three examples of models of type I, II and III are shown with loops bases in red and several individual loops rendered in different colors. Also shown is a schematic of a prometaphase chromosome with the helical winding of loops indicated by arrow around the loop array. (H) Parameters of the best 3 models of prometaphase chromosomes at different time points.
Fig. 4
Fig. 4. Defects in chromosome morphogenesis in condensin depleted cells
(A–C). Hi-C interaction frequency maps (binned at 100 kb) for chromosome 7 at indicated time points (top right in each heatmap) after release from G2 arrest. The first plot below each Hi-C interaction map displays the compartment signal (Eigenvector 1). The bottom graph shows the insulation score (TADs; binned at 50 kb). (A) SMC2-mAID cells were treated with auxin for three hours prior to release from G2 arrest to deplete SMC2. SMC2+: Hi-C interaction map for G2-arrested cells prior to auxin treatment. SMC2-: Hi-C interaction map for G2-arrested cells after three hours of auxin treatment. (B) Hi-C data for CAP-H2-mAID cells treated for three hours with auxin prior to release from G2 arrest to deplete CAP-H2. (C). Hi-C data for CAP-H-mAID cells treated for three hours with auxin prior to release from G2 arrest to deplete CAP-H.
Fig. 5
Fig. 5. Distinct roles for condensin I and II in mitotic chromosome formation
(A) Genome-wide curves of contact frequency P(s) vs genomic distance s, normalized to unity at s=100 kb. The curves are P(s) derived from Hi-C data obtained from CAP-H2-depleted (left panel) and CAP-H-depleted cells (right panel), at t = 7–60 minutes after release from G2 arrest. Dashed line indicates P(s) = s−0.5. (B) Overlayed P(s) curves of WT, CAP-H-and CAP-H2-depleted chromosomes show independent contributions of two condensin complexes to short- and long-distance contacts. (C) Polymer models of CAP-H2 (top) and CAP-H (bottom) depleted chromosomes. Top: depletion of CAP-H2 is modeled via removal of outer loops and relaxation of the helix.. Bottom: depletion of CAP-H is modeled via removal of the inner loops, while preserving the helical arrangement of the scaffold. Condensin II loop anchors are shown in red, condensin I loop anchors are shown in blue. (D) P(s) derived from late prometaphase CAP-H2 depletion Hi-C experiments (red line) and the three best fitting polymer models (grayscale lines). The average loop size and linear density of loops along the chromosome axis are indicated. (E) The average loop size and linear DNA density of the 3 best-fitting models of CAP-H2-depleted chromosomes at different time points. (F) P(s) derived from late prometaphase CAP-H depletion Hi-C experiments (blue line) and the best fitting polymer models with and without nested inner loops (grayscale lines). The average size of outer and inner loops, the length of a helix turn in Mb and the helical pitch are indicated. (G) The best fitting P(s) predictions by the staircase coarse grained model for late prometaphase CAP-H depletion Hi-C experiments at t = 30 minutes after release of G2 arrest (gray lines; experimental P(s): red lines. Top: loop size is 200 kb, bottom: loop size is 400 kb.
Fig. 6
Fig. 6. A mitotic chromosome morphogenesis pathway
In prophase, condensin II compacts chromosomes into arrays of consecutive loops and sister chromatids split along their length. The scaffold of condensin II-mediated loop bases is indicated in red. Upon nuclear envelope breakdown and entry into prometaphase, condensin II-mediated loops become increasingly large as they split into smaller ~80 kb loops by condensin I. Chromosomes are shown as arrays of loops (only inner loops can be observed microscopically; top: cross-section, bottom: side view. For clarity, loops are indicated as separate entities pointing in one direction, while in reality loops are unstructured and can mix). The nested arrangements of centrally located condensin II-mediated loop bases and more peripherally located condensin I-mediated loop bases are indicated in red and blue respectively. During prometaphase central scaffold acquires a helical arrangement with loops rotating around the scaffold as steps in a “spiral staircase” (helical path of loops is indicated by arrows). As prometaphase progresses outer loops grow and the number of loops per turn increases and chromosomes shorten to form the mature mitotic chromosome.

Comment in

References

    1. Dixon JR, et al. Topological domains in mammalian genomes identified by analysis of chromatin interactions. Nature. 2012;485:376–380. - PMC - PubMed
    1. Nora EP, et al. Spatial partitioning of the regulatory landscape of the X-inactivation centre. Nature. 2012;485:381–385. - PMC - PubMed
    1. Lieberman-Aiden E, et al. Comprehensive mapping of long-range interactions reveals folding principles of the human genome. Science (80-.) 2009;326:289–293. - PMC - PubMed
    1. Rao SS, et al. A 3D map of the human genome at kilobase resolution reveals principles of chromatin looping. Cell. 2014;159:1665–1680. - PMC - PubMed
    1. Sanyal A, Lajoie BR, Jain G, Dekker J. The long-range interaction landscape of gene promoters. Nature. 2012;489:109–113. - PMC - PubMed

Publication types