. 2018 Jan 18;9(1):272.
doi: 10.1038/s41467-017-02677-9.

Fibroblast growth factor 21 increases insulin sensitivity through specific expansion of subcutaneous fat

Affiliations

Fibroblast growth factor 21 increases insulin sensitivity through specific expansion of subcutaneous fat

Huating Li et al. Nat Commun. .

Abstract

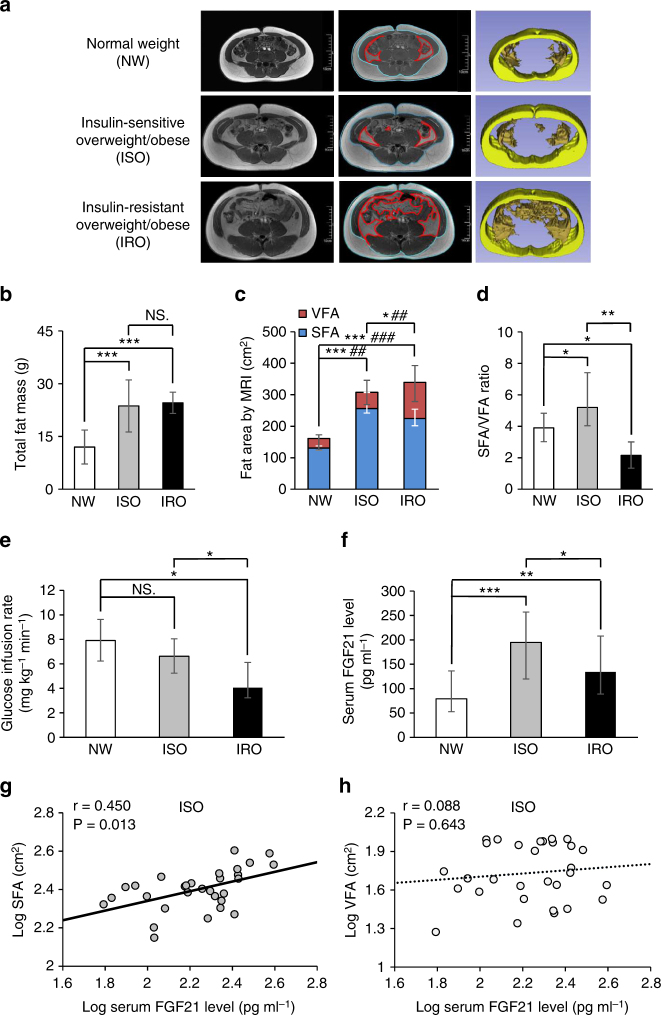
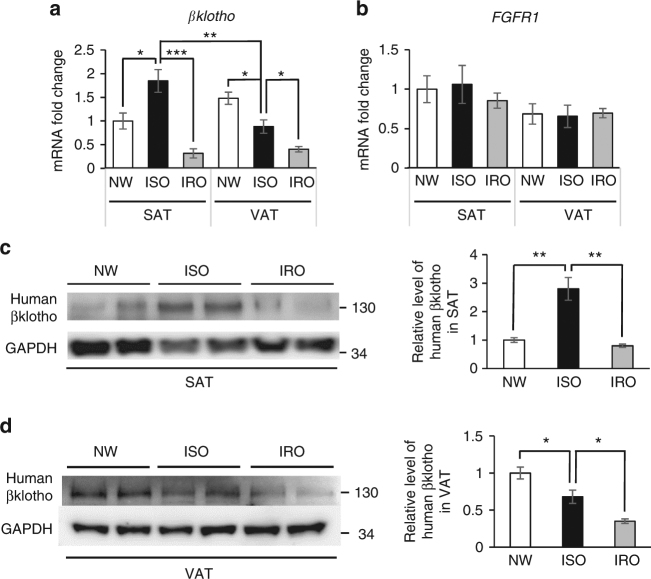
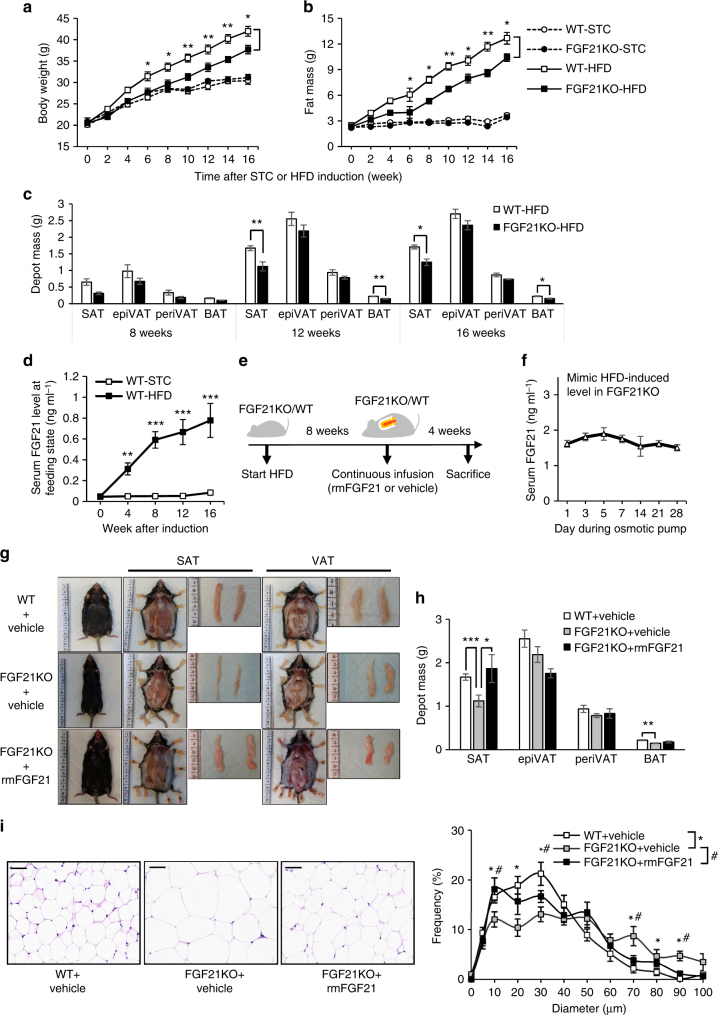
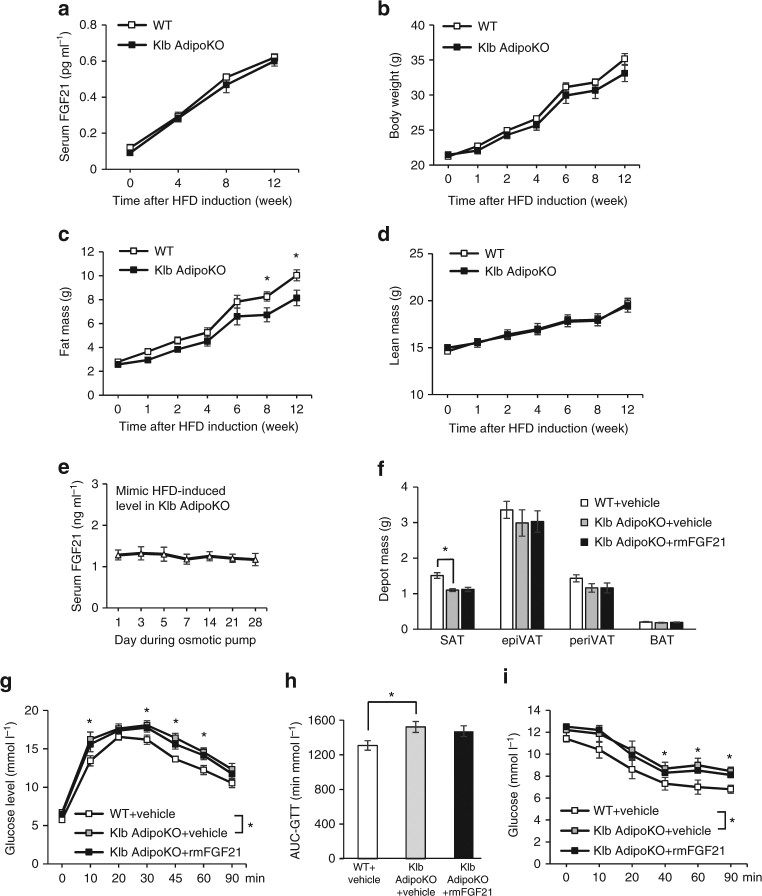
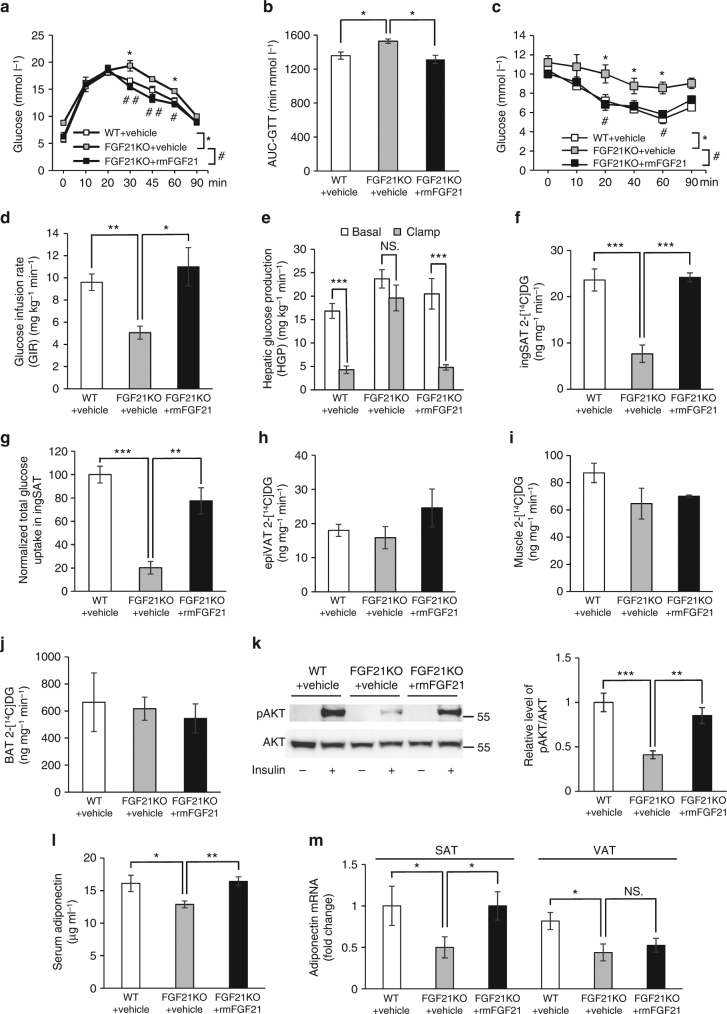
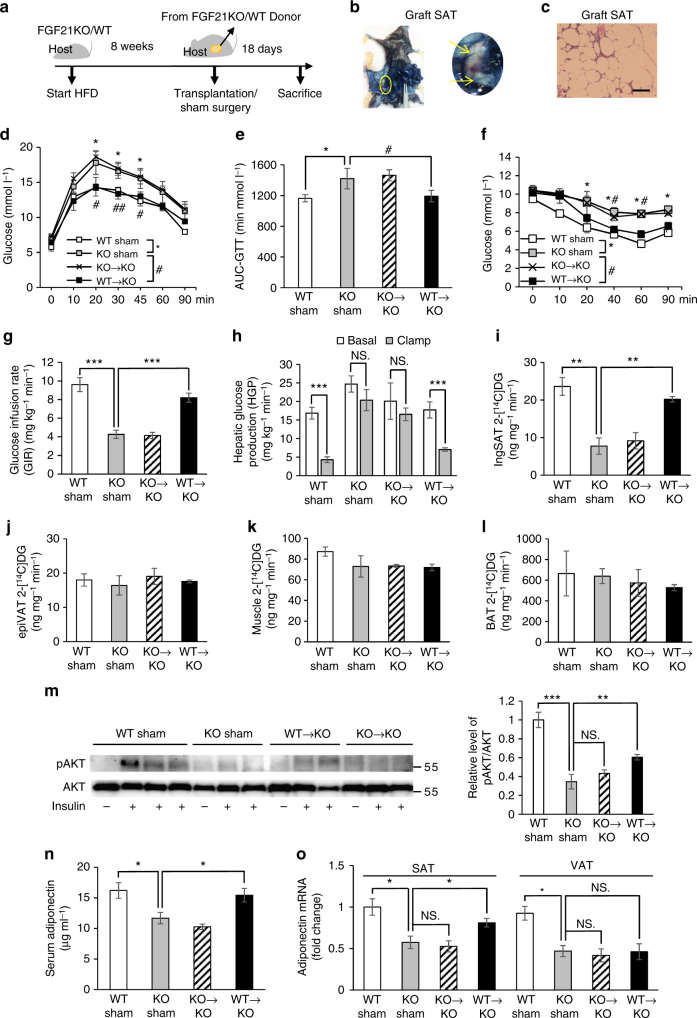
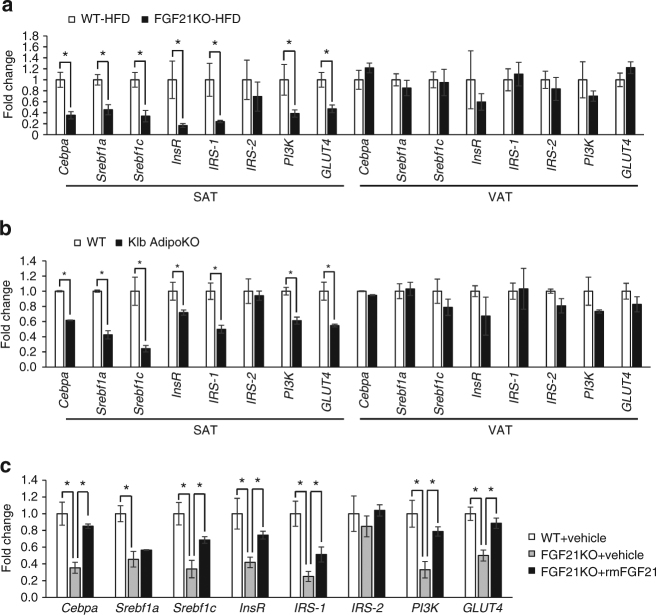
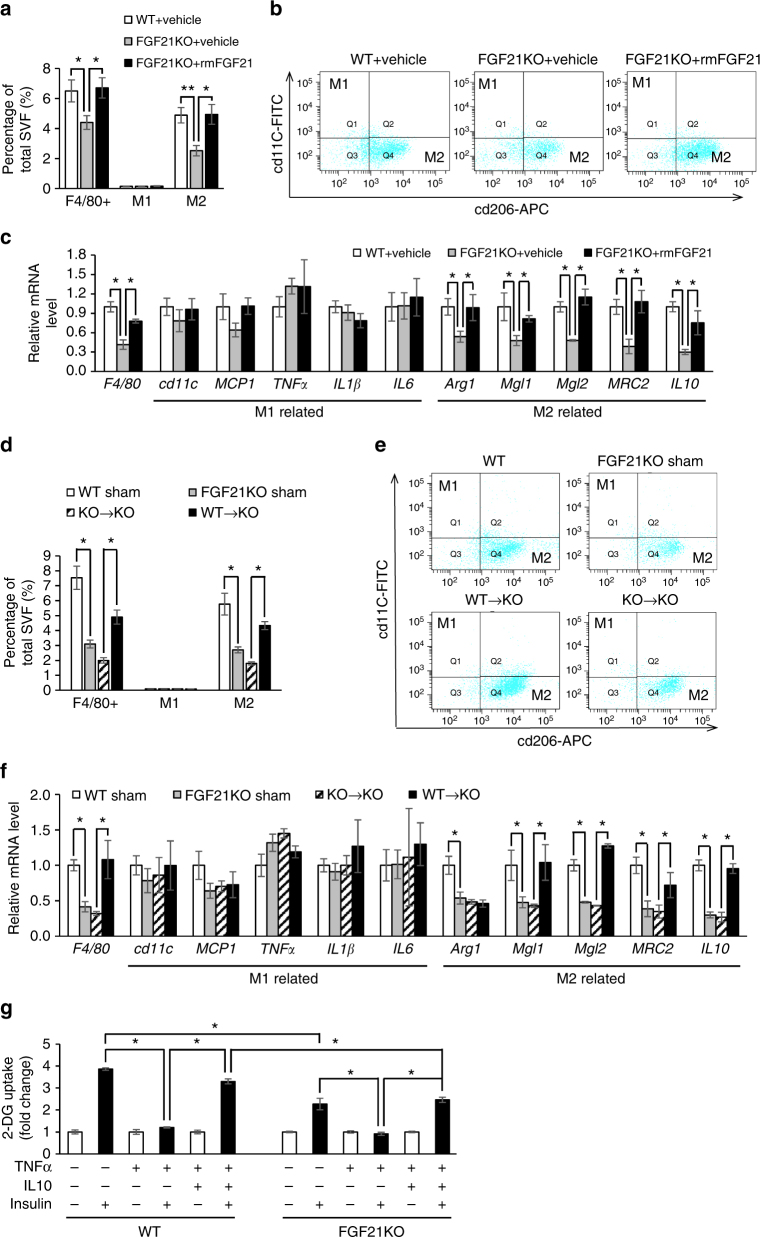
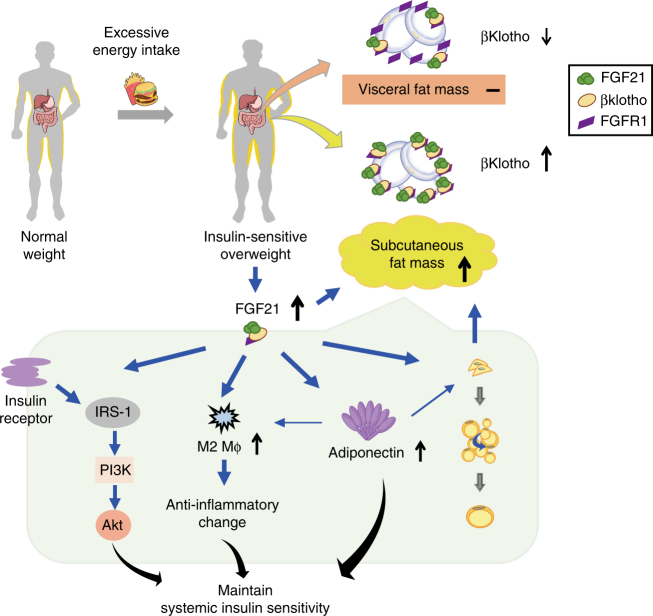
Although the pharmacological effects of fibroblast growth factor 21 (FGF21) are well-documented, uncertainty about its role in regulating excessive energy intake remains. Here, we show that FGF21 improves systemic insulin sensitivity by promoting the healthy expansion of subcutaneous adipose tissue (SAT). Serum FGF21 levels positively correlate with the SAT area in insulin-sensitive obese individuals. FGF21 knockout mice (FGF21KO) show less SAT mass and are more insulin-resistant when fed a high-fat diet. Replenishment of recombinant FGF21 to a level equivalent to that in obesity restores SAT mass and reverses insulin resistance in FGF21KO, but not in adipose-specific βklotho knockout mice. Moreover, transplantation of SAT from wild-type to FGF21KO mice improves insulin sensitivity in the recipients. Mechanistically, circulating FGF21 upregulates adiponectin in SAT, accompanied by an increase of M2 macrophage polarization. We propose that elevated levels of endogenous FGF21 in obesity serve as a defense mechanism to protect against systemic insulin resistance.


Conflict of interest statement

The authors declare no competing financial interests.

Figures

Fig. 1
Fig. 1
Positive association between FGF21 and SFA in ISO individuals. a Representative abdominal MRI of three groups of individuals, including NW (n = 30), ISO (n = 30) and IRO (n = 30). Raw (left panel) and marked MRI (middle panel) at navel level, blue lines delineate SFA and red lines delineate VFA, 3D-reconstructed MRI (right panel) after eliminating other organs, yellow represents subcutaneous fat area (SFA) and orange represents visceral fat area (VFA). Scale bar = 10 cm. b Total fat mass in three groups. c Fat distribution (SFA and VFA contents) evaluated by MRI in three groups. *comparison of SFA, #comparison of VFA. d SFA and VFA ratio in three groups. e Comparison of glucose infusion rate evaluated by hyperinsulinemic–euglycemic clamp in three groups. f Serum FGF21 levels measured by ELISA in three groups. g,h Relationship between serum FGF21 levels and g SFA as well as h VFA in individuals with ISO. Data are presented as mean ± s.d. or median (interquartile range). Significance was determined by one-way analysis of variance (ANOVA) with Bonferroni multiple-comparison analysis (bf) and Pearson’s correlations (g, h). * or # P < 0.05, ** or ## P < 0.01, *** or ### P < 0.001, NS. non-significance
Fig. 2
Fig. 2
βklotho exhibits fat depot-difference in the development of obesity. a Change of βklotho expression in SAT and VAT of humans with NW, ISO and IRO. All data were normalized to βklotho expression in SAT of NW individuals. n = 8–12. b Change of FGFR1 expression in SAT and VAT of individuals with NW, ISO and IRO. All data were normalized to FGFR1 expression in SAT of NW individuals. n = 8–12. c,d Representitive figure of western blot analysis and densitometric quantification of human βklotho protein levels in (c) SAT and (d) VAT of individuals with NW, ISO and IRO (n = 5). Data are presented as mean ± s.e.m. Significance was determined by one-way ANOVA with Bonferroni multiple-comparison analysis. *P < 0.05, **P < 0.01, ***P < 0.001
Fig. 3
Fig. 3
FGF21 is required for the accumulation of SAT mass in diet-induced obesity. Eight-week-old, male FGF21KO and WT littermates were fed with STC or HFD for 16 weeks (n = 10–12). a, b Body weight (a) and fat mass were measured once every 2 weeks (b). c Depot mass of SAT, epiVAT, periVAT and interscapular BAT depots in FGF21KO and WT mice fed with HFD. d Serum FGF21 levels at feeding state in WT mice during STC or HFD induction were measured by ELISA. e Schematic diagram of rmFGF21 replenishing strategy. After 8-week HFD induction, FGF21KO mice were randomly divided into FGF21KO + rmFGF21 group (0.1 mg kg−1 day−1 rmFGF21 by osmotic pump to mimic HFD-induced circulating FGF21 level) and FGF21KO + Vehicle group (receiving saline by osmotic pump) for another 4 weeks. The WT group also received continuous infusion of saline. n = 6. These results were reproduced in four independent experiments. f Serum FGF21 levels in FGF21KO + rmFGF21 group during the intervention. g Effect of physiologically-relevant dose of rmFGF21 administration on subcutaneous and visceral fat mass. Representative photographs of body appearance, subcutaneous fat and dissected SAT, visceral fat and dissected epiVAT from three groups. h Depot mass of SAT, epiVAT, periVAT and BAT depots in three groups. i H&E staining on paraffin sections from SAT in three groups. Scale bar = 50 μm. Cell size profiling of adipocytes from SAT was compared among three groups. The values show % from the total number of analyzed cells. Data are presented as mean ± s.e.m. Significance was determined by student’s t test (c, d), one-way ANOVA (h, i) and two-way ANOVA with Bonferroni multiple-comparison analysis (a, b). * or # P < 0.05, **P < 0.01, ***P < 0.001
Fig. 4
Fig. 4
Klb AdipoKO mice do not benefit from physiological dose of rmFGF21. Eight-week-old, male WT and Klb AdipoKO mice were fed with HFD for 12 weeks. n = 8. a Serum FGF21 levels at fed state in WT and Klb AdipoKO mice during HFD induction were measured by ELISA. b–d Body weight (b), fat mass (c) and lean mass (d) were measured at various time periods. After 8-week HFD induction, Klb AdipoKO mice were randomly divided into Klb AdipoKO + rmFGF21 group (0.05 mg kg-1 day-1 rmFGF21 by osmotic pump to mimic HFD-induced circulating FGF21 level) and Klb AdipoKO + Vehicle group (receiving saline by osmotic pump) for another 4 weeks. The WT group also received continuous infusion of saline. n = 6. e Serum FGF21 levels in Klb AdipoKO + rmFGF21 group during the intervention. f Adipose tissue mass was measured for SAT, epiVAT, periVAT and BAT depots in three groups after 4 weeks of intervention. g, h Glucose tolerance test (GTT) (g) was performed and area under curve (AUC) analysis of GTT (h), Insulin tolerance test (ITT) (i) was performed in three groups after 4 weeks of intervention. Data are presented as mean ± s.e.m. Significance was determined by student’s t test (ad), one-way ANOVA (f,h) and two-way ANOVA with Bonferroni multiple-comparison analysis (g, i). *P < 0.05
Fig. 5
Fig. 5
Physiological dose of rmFGF21 restores insulin sensitivity in FGF21KO mice. a–c GTT (a), AUC analysis of GTT (b) and ITT performed in WT+Vehicle (c), FGF21KO + Vehicle and FGF21KO+rmFGF21 groups after 4 weeks of intervention. n = 6. These results were reproduced in four independent experiments. *comparison of WT + Vehicle vs. FGF21KO + Vehicle, #comparison of FGF21KO + Vehicle vs. FGF21KO + rmFGF21. d Whole-body insulin sensitivity as quantified by GIR. n = 6. These results of hyperinsulinemic–euglycemic clamp were reproduced in two independent experiments. e HGP in the basal and clamp state. f–j Insulin-stimulated 2-[14C]DG uptake in inguinal SAT (f, g), epiVAT (h), muscle (i) and BAT among three groups after 4 weeks of intervention (j). k Immunoblot of in vivo insulin-stimulated SAT after replenishment with rmFGF21 to HFD-induced level in FGF21KO mice. Representative immunoblots showing phospho (S473) and total Akt in the SAT of three groups. The tissues were collected at 10 min after single i.v. injection of insulin (1 U kg−1) in mice. n = 6. The bar chart shows the densitometric analysis of phosphorylation levels. l, m Change of serum adiponectin (l) and adiponectin expression in different fat depots (SAT and VAT) among WT+Vehicle, FGF21KO+Vehicle and FGF21KO +rmFGF21 groups after 4 weeks of intervention were measured by ELISA and RT-qPCR (m). n = 6. These results were reproduced in four independent experiments. Data are presented as mean ± s.e.m. Significance was determined by one-way ANOVA (b,dm) and two-way ANOVA with Bonferroni multiple-comparison analysis (a, c). * or # P < 0.05, ** or ## P < 0.01, ***P < 0.001, NS non-significance
Fig. 6
Fig. 6
Transplantation of SAT from WT to FGF21KO mice improves insulin sensitivity. a Schematic diagram of transplantation strategy. After 8-week HFD induction, a total of 0.85g-subcutaneous fat from WT or FGF21KO donor mice was transplanted into the inguinal area of FGF21KO host mice (KO→KO and WT→KO groups). WT Sham and FGF21KO Sham groups had surgery in the same area, but no fat was transplanted. Eighteen days after fat transplantations, various measurements were carried out. n = 6. These results were reproduced in three independent experiments. b Evans blue i.v. injection into host mice to prove vascularization of the fat grafts at 2 weeks after transplantation. c Hematoxylin and eosin-stained fat grafts showed normal morphology of adipocytes. Scale bar = 50 μM. d–f GTT (d), AUC analysis of GTT (e) and ITT performed in all four groups including WT Sham, KO Sham, KO→KO and WT→KO (f). *comparison of WT Sham, vs. KO Sham, #comparison of KO Sham vs. WT→KO. g Whole-body insulin sensitivity as quantified by GIR. h–l HGP in the basal and clamp state (h), insulin-stimulated 2-[14C]DG uptake in inguinal SAT (i), epiVAT (j), muscle (k) and BAT among all four groups (l). (m) Immunoblot of in vivo insulin-stimulated SAT in transplantation cohort. n = 6. Representative immunoblots showing phospho (S473) and total Akt in the endogenous SAT of all four groups. The tissues were collected at 10 min after single i.v. injection of insulin (1 U kg−1). The bar chart shows densitometric analysis of phosphorylation levels. n,o Change of serum adiponectin (n) and adiponectin expression in different fat depots (SAT and VAT) in the WT Sham, KO Sham, KO→KO and WT→KO groups at 18th day after fat transplantation (o). n = 6. These results were reproduced in three independent experiments. Data are presented as mean ± s.e.m. Significance was determined by Student’s t-test analysis (h), one-way ANOVA (e, g, io) and two-way ANOVA with Bonferroni multiple-comparison analysis (d, f). * or # P < 0.05, ** or ## P < 0.01, ***P < 0.001, NS non-significance
Fig. 7
Fig. 7
FGF21KO and Klb AdipoKO mice have altered gene expressions in SAT. a The expression of the genes involved in adipogenesis and insulin signaling in SAT and VAT of WT and FGF21KO mice fed on HFD for 8 weeks. All the mice were killed during the fed state. n = 8–10. b Related gene expression in the SAT and VAT of WT and Klb AdipoKO mice fed with HFD for 8 weeks. All the mice were killed during the fed state. n = 8. c Related gene expression in SAT among WT + Vehicle, FGF21KO + Vehicle and FGF21KO + rmFGF21 groups after 4 weeks’ intervention. n = 6. These results were reproduced in four independent experiments. Data are presented as mean ± s.e.m. Significance was determined by student’s t test (a, b) and one-way ANOVA with Bonferroni multiple-comparison analysis (c). *P < 0.05
Fig. 8
Fig. 8
FGF21 promotes M2 macrophage polarization specifically in SAT. a–c After 8-week HFD induction and 4 weeks of treatment by vehicle or physiologically relevant dose of rmFGF21 (0.1 mg kg−1 day−1), another cohort of WT + Vehicle, FGF21KO + Vehicle and FGF21KO + rmFGF21 mice were killed for flow cytometry and other following experiments. a Flow cytometry analysis for total, M1 and M2 macrophages in SVF of SAT. b Representative plot chats of flow cytometry analyzing M1 and M2 macrophages after gating F4/80+ cells in SAT. M2 macrophages were defined as F4/80+cd11clowcd206high and M1 macrophages were defined as F4/80+cd11chighcd206low. The gating strategy is described in Supplementary Fig. 6a. c RT-qPCR analysis for mRNA expression levels of F4/80, M1 and M2 macrophages related genes. n = 6. These results were reproduced in two independent experiments. (d–f) At 18th day after fat transplantation, another cohort of WT Sham, KO Sham, KO→KO and WT→KO mice were killed for flow cytometry and other following experiments. d Flow cytometry analysis for total, M1 and M2 macrophages in SVF of SAT. e Representative plot chats of flow cytometry analyzing M1 and M2 macrophages in SAT. f RT-qPCR analysis for mRNA expression levels of F4/80, M1 and M2 macrophages related genes. n = 6. These results were reproduced in two independent experiments. g Insulin-stimulated glucose uptake in adipocytes chronically treated with interleukin (IL)-10 and tumor necrosis factor (TNF)-α. Differentiated SVF adipocytes from WT and FGF21KO mice were treated with low-dose TNFα (3 ng ml−1) for 72 h in the presence or absence of IL10 (20 ng ml−1). Without (white bars) or with insulin (black bars) (100 nm) stimulation, 2-DG uptake was assessed. n = 6 wells. These results were reproduced in three independent experiments. Data are presented as mean ± s.e.m. Significance was determined by one-way ANOVA with Bonferroni multiple-comparison analysis. *P < 0.05, **P < 0.01
Fig. 9
Fig. 9
Proposed action of FGF21 on systemic insulin sensitivity by expansion of SAT. Due to excessive energy intake, individuals with normal weight can develop insulin-sensitive overweight featured by the expansion of subcutaneous fat mass. Circulating FGF21 acts in an endocrine manner on subcutaneous fat to promote the healthy expansion. Such an adipose-specific action of FGF21 is attributed to high level of expression of the FGF21 receptor complex. FGF21 upregulates adiponectin in subcutaneous fat, consistent with an increase of M2 macrophage polarization in the subcutaneous adipocytes and the following anti-inflammatory change. These factors maintain systemic insulin sensitivity. Elevated endogenous FGF21 in response to dietary-induced obesity serves as a defense mechanism against systemic insulin resistance

References

    1. Fisher FM, Maratos-Flier E. Understanding the physiology of FGF21. Annu. Rev. Physiol. 2016;78:223–241. doi: 10.1146/annurev-physiol-021115-105339. - DOI - PubMed
    1. Kharitonenkov A, et al. FGF-21 as a novel metabolic regulator. J. Clin. Invest. 2005;115:1627–1635. doi: 10.1172/JCI23606. - DOI - PMC - PubMed
    1. Coskun T, et al. Fibroblast growth factor 21 corrects obesity in mice. Endocrinology. 2008;149:6018–6027. doi: 10.1210/en.2008-0816. - DOI - PubMed
    1. Xu J, et al. Fibroblast growth factor 21 reverses hepatic steatosis, increases energy expenditure, and improves insulin sensitivity in diet-induced obese mice. Diabetes. 2009;58:250–259. doi: 10.2337/db08-0392. - DOI - PMC - PubMed
    1. Kharitonenkov A, et al. The metabolic state of diabetic monkeys is regulated by fibroblast growth factor-21. Endocrinology. 2007;148:774–781. doi: 10.1210/en.2006-1168. - DOI - PubMed

Publication types