. 2018 Jan 18;9(1):279.
doi: 10.1038/s41467-017-02648-0.

Medial preoptic area in mice is capable of mediating sexually dimorphic behaviors regardless of gender

Affiliations

Medial preoptic area in mice is capable of mediating sexually dimorphic behaviors regardless of gender

Yi-Chao Wei et al. Nat Commun. .

Abstract

The medial preoptic area (mPOA) differs between males and females in nearly all species examined to date, including humans. Here, using fiber photometry recordings of Ca2+ transients in freely behaving mice, we show ramping activities in the mPOA that precede and correlate with sexually dimorphic display of male-typical mounting and female-typical pup retrieval. Strikingly, optogenetic stimulation of the mPOA elicits similar display of mounting and pup retrieval in both males and females. Furthermore, by means of recording, ablation, optogenetic activation, and inhibition, we show mPOA neurons expressing estrogen receptor alpha (Esr1) are essential for the sexually biased display of these behaviors. Together, these results underscore the shared layout of the brain that can mediate sex-specific behaviors in both male and female mice and provide an important functional frame to decode neural mechanisms governing sexually dimorphic behaviors in the future.


Conflict of interest statement

The authors declare no competing financial interests.

Figures

Fig. 1
Fig. 1
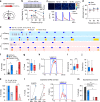
mPOA neural dynamics during social behaviors. a Schematics of the fiber photometry experiment. Fluorescent signals were recorded using an integrated setup. At the bottom, example traces of ΔF/F signals with behavioral annotations underneath. b Heat map representation of ΔF/F signals around social investigations (SI) averaged at the animal level with time “0” aligned to the onset of the behavior. Scale shown on the right applies to all heat maps in this figure. c Example heat map representations of ΔF/F signals around events of SI alone (top) or those that were followed by mount (bottom). Light blue lines in the bottom panel denote the onset of mount for each event. d, e Quantification of ΔF/F signals associated with SI alone or those followed by mount in males (left) and females (right) in d, and mount followed by pelvic thrust or not in males (left) and females (right) in e. Lines indicate mean values and the shaded area standard error of mean (s.e.m.). Vertical black bars in d denote when mount behaviors were initiated on average. Green dots underneath indicate a significant difference between the two lines at the corresponding time point by unpaired t test with a false discovery rate of 0.05. d SI, N = 16 males and 16 females; Mount, N = 13 males and 10 females; e N = 6 males and 4 females. f Significant correlation between total number of Ca2+ transients and the total number of mount between the first and last mounting behavior in a trial by Pearson’s correlation. N = 11 trials for males and 8 trials for females. g Comparison of numbers of Ca2+ transients (left) and numbers of mount (right) in f between males and females at the animal level. N = 8 males and 8 females. Unpaired t test. *p < 0.05, **p < 0.01. h, i Heat map representations of ΔF/F signals around pup contacts (h) and pup retrieval (i) at the animal level with time “0” aligned to the onset of the behavior. j, k Quantification of ΔF/F signals associated with pup contact and pup retrieval in males (left) and females (right) in j and crouching behavior in females in k
Fig. 2
Fig. 2
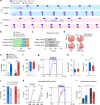
Optogenetic activation of male-typical mounting in both sexes. a The strategy to optogenetically activate the mPOA. b Electrophysiological recordings of ChR2-expressing neurons in freshly cut brain slices. N = 25 male cells and 23 female cells. c Calcium imaging of acute brain slices were performed under a two-photon microscope at different stimulation frequencies as representative images showing at the top. ΔF/F values were averaged cross cells and plotted at the bottom with the blue bars indicating laser stimulation and the line and the shading indicating the mean and the s.e.m., respectively. N = 358 male neurons and 292 female neurons. Scale bar, 50 μm. d Average percentage of neurons activated at each tested frequency. N = 6 brain sections for males and 4 for females. e Representative raster plots of behaviors (color coded) displayed by mCherry and ChR2 animals of either sex during a behavioral trial in which a hormonal primed ovariectomized female was given as the stimulus. Blue bars indicate periods of light stimulation. fj Photostimulation elicited male-typical mounting behavior toward hormonal primed ovariectomized females. The percentage of animals that displayed mounting behavior during photostimulation (f), trial-by-trial occurrence (g), average distribution (h), the latency (i), and average duration (j) of optogenetically activated mounting behavior were plotted. N = 83 ChR2 and 11 mCherry for males, and 58 ChR2 and 15 mCherry for females. k Percentage of ChR2 animals that displayed light-induced mounting behavior at low power of stimulation and high power. N = 9 males and 11 females. l Occurrence and distribution of mounting behavior before (bef.), during (dur.), and after light stimulation in those ChR2 animals, which had been castrated for >3 weeks. N = 9 males and 6 females. m Spontaneous mounting behavior that occurred outside of photostimulation. N = 83 ChR2 and 11 mCherry for males, and 58 ChR2 and 15 mCherry for females. Fisher’s exact test in f, k, and m. Unpaired t test in i. Paired t test in l. *p < 0.05, **p < 0.01, ***p < 0.001
Fig. 3
Fig. 3
Optogenetic activation of pup retrieval in both sexes. a Representative raster plots of behaviors (color coded) of mCherry and ChR2 animals of either sex during a behavioral trial in which scattered pups were given as the stimuli. Blue bars indicate periods of light stimulation. b Body regions of a pup contacted by ChR2 animals during optogenetically induced retrieval compared with spontaneous retrieval in virgin females (female_spon). N = 43 ChR2 males, 42 ChR2 females, and 10 virgin females. c Percentage of optogenetically induced retrieval bouts that resulted in a pup being brought to the nest in male and female ChR2 animals compared to spontaneous retrieval in virgin females (female_spon). N = 8 ChR2 males, 5 ChR2 females, and 10 virgin females. d Distribution of ChR2 animals of both sexes that grouped pups or fake pups. Only animals that did not display spontaneous pup retrieval were analyzed. Grouping was defined by the appearance of ≥2 pups or fake pups together at the end of the behavioral trial. ei Quantification of optogenetically induced pup retrieval behavior in both sexes. The percentage of animals that displayed pup retrieval behavior during photostimulation (e), trial-by-trial occurrence (f), average distribution (g), the latency (h), and average duration (i) of light-induced pup retrieval behaviors were plotted. N = 66 ChR2 and 11 mCherry for males, and 56 ChR2 and 15 mCherry for females. j Percentage of ChR2 animals showing light-induced retrieval behavior under low power and high power of stimulation. N = 8 males and 12 females. k Occurrence and distribution of pup retrieval before (bef.), during (dur.), and after light stimulation in ChR2 animals that had been castrated for >3 weeks. N = 5 males and 6 females. l Spontaneous pup retrieval behavior outside of photostimulation period. N = 66 ChR2 and 11 mCherry for males, and 56 ChR2 and 15 mCherry for females. Fisher’s exact test in e and l. Unpaired t test in i. Paired t test in k. *p < 0.05, ***p < 0.001
Fig. 4
Fig. 4
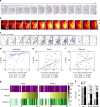
Correlation between optogenetically induced c-Fos expression and behaviors. a Example images of DAB staining of light-induced c-Fos expression in a ChR2 animal along the anterior–posterior axis at ~80 μm intervals. Scale bar, 200 μm. b Heat map representation of light-induced c-Fos expression averaged across animals. Briefly, c-Fos signals within each 100 μm2 square in a 1100 × 1500 μm area as in a were counted, tallied, averaged, plotted, and projected onto a reference atlas (http://www.brain-map.org/, image 49–61). White bold lines highlight the mPOA defined by the atlas. Scale shown on the right. c Activation centers for ChR2 animals. N = 66 males and 53 females. df Correlation between total number of c-Fos signals in sections highlighted with the thick black line in c and the trial occurrence of light-induced locomotion (d), mount (e), and pup retrieval (f) for both male and female ChR2 animals. Pearson’s correlation. g Distribution of optogenetic-induced locomotion, mount, and pup retrieval (color coded) in ChR2 males (left) and females (right) with each column corresponding to a ChR2 animal and the shade of each cell corresponding to the trial occurrence of the behavior indicated on the left. The scale bar is on the right. Animals were sorted according to the occurrence of light-induced mounting behavior. Out of 35 males and 33 females that displayed light-induced mounting, 31 males and 31 females also displayed light-induced pup retrieval. Of 26 males and 22 females that did not display light-induced mounting, only 8 males and 10 females displayed light-induced pup retrieval. h Categorical comparison of the occurrence of light-induced locomotion, mount, and pup retrieval at the animal level between groups whose activation center lie within or close to the mPOA, as in sections highlighted with a black line in c (hit), and those away from the mPOA (miss). Filled segments indicate the fraction of animals in each group that displayed optogenetically induced behaviors listed below while corresponding empty segments indicate the fraction that did not display the behavior. Fisher’s exact test. *p < 0.05, **p = 0.01
Fig. 5
Fig. 5
Neural dynamics of mPOA Esr1+ neurons during social behaviors. a Schematics of the strategy to record activities of Esr1+ neurons. b Example images showing co-localization of GCaMP6s and Esr1 signals. Images on the bottom are blowups of the corresponding white squares in the images on the top. Dashed lines show the placement of the optic fiber. Scale bar represents 200 μm for images on the top and 20 μm for images at the bottom. cf Heat map plots (c, e) and quantification (d, f) of ΔF/F signals around events of social investigations (SI) and mount (M) in male and female Esr1Cre GCaMP6s animals during social interactions with a female or around events of pup contacts (C) and pup retrieval (R) during interactions with scattered pups, with time “0” aligned to the onset of behaviors. Scale bar in c applies to all heat maps in this figure. In d and f, lines indicate the mean and the shaded area the s.e.m. N = 12 males and 11 females. g, h Significant correlation between total number of Ca2+ transients in mPOA Esr1+ neurons and the total number of mount (g) and retrieval (h) between the first and last behavior in a trial. Mount, N = 13 trials for males and 5 trials for females; retrieval, N = 6 trials for males and 12 trials for females. Pearson’s correlation
Fig. 6
Fig. 6
catFISH analysis of mPOA neuronal activation during social interactions with a female or scattered pups. a Following two sequential social interactions with either a female (F) or scattered pups (P), as indicated at the top, animals were processed to stain for c-Fos mRNA, shown in cyan, c-Fos intron in magenta, and Esr1 mRNA in blue with DAPI as the counter staining (not shown). Images on the right are blown ups of white boxes in images on the left with numbers indicating whether the identified nearby cell expresses nuclear c-Fos only (1), or cytoplasmic c-Fos only (2), or both (3). Scale bar represents 50 μm for images on the left and 10 μm for images on the right. b, c Quantification of the percentage of Esr1+ neurons (b) and non-Esr1+ neurons (c) with nuclear c-Fos that co-expressed cytoplasmic c-Fos under each test condition. F-F female-female, P-P pup-pup, F-P female-pup, P-F pup-female. For Esr1+ neurons, the percentage was significantly higher in animals exposed to the same stimuli compared to those to different stimuli. For non-Esr1+ neurons, the percentage was only found to be different between the “F-F” and “P-F” group in males. One-way ANOVA with Bonferroni correction. N = 3 per condition per sex. **p < 0.01, ***p < 0.001
Fig. 7
Fig. 7
Effects of activating and ablating mPOA Esr1+ neurons on mount and pup retrieval. ac Optogenetic activation of mPOA Esr1+ neurons elicited mount and pup retrieval. a AAVs encoding Cre-inducible ChR2 were injected unilaterally into the mPOA of Esr1Cre animals. b Representative images showing expression of ChR2 as indicated by mCherry signal in Esr1+ neurons. Scale bar represents 200 μm for images on the top and 20 μm for images at the bottom. c Percentage of trials that animals displayed mount or pup retrieval in mCherry and ChR2 animals before, during (blue bars), and after phasic photostimulation (12 mW, 10 ms, 40 Hz, 15 s). For mount, N = 8 ChR2 and 9 mCherry males and 10 ChR2 and 8 mCherry females. For retrieval, N = 9 ChR2 and 9 mCherry males and 10 ChR2 and 8 mCherry females. Paired t test. *p < 0.05, **p < 0.01. df Ablation of mPOA Esr1+ neurons abolished sex differences in mount and pup retrieval. d AAVs encoding Cre-inducible taCasp3 were injected bilaterally into the mPOA of Esr1Cre animals to ablate Esr1+ neurons. e Example images of Esr1+ immunostaining in green and Nissl as the counter staining in blue in control and experimental animals of both sexes with quantification of Esr1+ signals shown on the right. Two-way ANOVA followed by Bonferroni post tests showed: virus effect, F(1, 22) = 44.43, p < 0.0001, sex effect, F(1, 22) = 7.38, p < 0.05, interaction effect, F(1, 22) = 2.52, p = 0.127. N = 8 Casp3 and 5 control males and 6 Casp3 and 7 control females. Scale bar, 300 μm. f Sex differences in mounting behavior and pup retrieval were abolished in Esr1Cre animals injected with Casp3 virus. Mount, two-way ANOVA followed by Bonferroni post tests for mount count: virus effect, F(1, 29) = 17.28, p < 0.001, sex effect, F(1,29) = 4.79, p < 0.05, interaction effect, F(1, 29) = 5.74, p < 0.05. Retrieval, two tailed Fisher’s exact test, p < 0.001, Casp3 vs. control in females. N = 9 Casp3 and 7 control males and 9 Casp3 and 8 control females
Fig. 8
Fig. 8
Optogenetic inhibition of mPOA Esr1+ neurons disrupts male-typical mating in both sexes. a Schematics of the strategy to optogenetically inhibit mPOA Esr1+ neurons. b Representative images showing expression of GtACR1 as indicated by EGFP in Esr1+ neurons. Scale bar, 300 μm, top; 20 μm, bottom. c Electrophysiological recordings of GtACR1-expressing neurons. Action potentials induced by withholding the membrane potential −48 mW with a current injection of 25 pA were blocked under continuous blue light stimulation. d Quantification of firing rates before (pre), during (dur.), and after (post) light stimulation. N = 5 male cells and 5 female cells. Paired t test. e Light delivery was triggered when the tested animal was within one body length distance to the female stimulus. Number of social investigation, percentage of trials with mount behavior and number of mounts for GtACR1 and control males in light and no-light trials were plotted and compared. N = 10 EGFP and 17 GtACR1 males. f A 10 s light pulse was delivered after the initiation of mount. The distribution of mount (M) and pelvic thrust (PT), the cumulative distribution of mount duration and the percentage trials with mount transitioning into pelvic thrust were plotted and compared between EYFP and GtACR1 males. N = 7 EYFP and 9 GtACR1 males. g A 10 s light pulse was delivered after the initiation of pelvic thrust. The distribution of pelvic thrust (PT), the cumulative distribution of duration of pelvic thrust and the percentage trials with pelvic thrust terminating during light stimulation were plotted and compared between EYPF and GtACR1 males. N = 7 EYFP and 9 GtACR1 males. h Females were treated with subcutaneous injection of testosterone. Light delivery was triggered when the tested animal was within one body length distance to the female stimulus. Number of social investigation, percentage of trials with mount behavior, and number of mounts in GtACR1 and control females during light or no-light trials were plotted and compared. N = 5 EYFP and 9 GtACR1 females. In e and h, t test or Wilcoxon rank-sum test, left and right, Fisher’s exact test, middle. In f and g, two-sample ks-test, middle, unpaired t test, right. *p < 0.05, **p < 0.01, ***p < 0.001
Fig. 9
Fig. 9
Optogenetic inhibition of mPOA Esr1+ neurons disrupts pup retrieval in both virgin and lactating females. a In virgin females, light was delivered when animals were within pre-specified distance to pups, number of pup contacts, percentage of trials with pup retrieval behavior, and number of pups retrieved to the nest were plotted and compared between no-light and light trials for both GtACR1 and control females. N = 7 EYFP and 8 GtACR1. b In virgin females, a 5 s light pulse was delivered after initiation of each retrieval, cumulative distribution of retrieval duration and the percentage of retrieval bouts that brought a pup to the nest were plotted and compared between GtACR1 and control females. N = 3 EYFP and 3 GtACR1. c In virgin females, 10 s light pulses were delivered during crouching, cumulative distribution of crouching duration was plotted and compared between GtACR1 and control females. N = 3 EYFP and 2 GtACR1. df In lactating females, light was delivered when animals were within pre-specified distance to pups (d), or a 5 s light pulse was delivered after initiation of retrieval (e), or 10 s light pulses were delivered during crouching (f), and similar parameters were plotted as in virgin females. In d, N = 5 EYFP and 8 GtACR1; in e, N = 3 EYFP and 6 GtACR1; In f, N = 3 EYFP and 5 GtACR1. In a and d, t test or Wilcoxon rank sum test, left and right, Fisher’s exact test, middle. In b and e, ks-test, left, Fisher’s exact test, right. *p < 0.05, **p < 0.01, ***p < 0.001

References

    1. Kelley DB. Sexually dimorphic behaviors. Annu. Rev. Neurosci. 1988;11:225–251. doi: 10.1146/annurev.ne.11.030188.001301. - DOI - PubMed
    1. Ruta V, et al. A dimorphic pheromone circuit in Drosophila from sensory input to descending output. Nature. 2010;468:686–690. doi: 10.1038/nature09554. - DOI - PubMed
    1. Oren-Suissa M, Bayer EA, Hobert O. Sex-specific pruning of neuronal synapses in Caenorhabditis elegans. Nature. 2016;533:206–211. doi: 10.1038/nature17977. - DOI - PMC - PubMed
    1. Simerly RB. Wired for reproduction: organization and development of sexually dimorphic circuits in the mammalian forebrain. Annu. Rev. Neurosci. 2002;25:507–536. doi: 10.1146/annurev.neuro.25.112701.142745. - DOI - PubMed
    1. Yang CF, Shah NM. Representing sex in the brain, one module at a time. Neuron. 2014;82:261–278. doi: 10.1016/j.neuron.2014.03.029. - DOI - PMC - PubMed

Publication types

Substances