. 2018 Jan 18;8(1):1058.
doi: 10.1038/s41598-018-19548-y.

Increased diversity with reduced "diversity evenness" of tumor infiltrating T-cells for the successful cancer immunotherapy

Affiliations

Increased diversity with reduced "diversity evenness" of tumor infiltrating T-cells for the successful cancer immunotherapy

Akihiro Hosoi et al. Sci Rep. .

Erratum in

Abstract

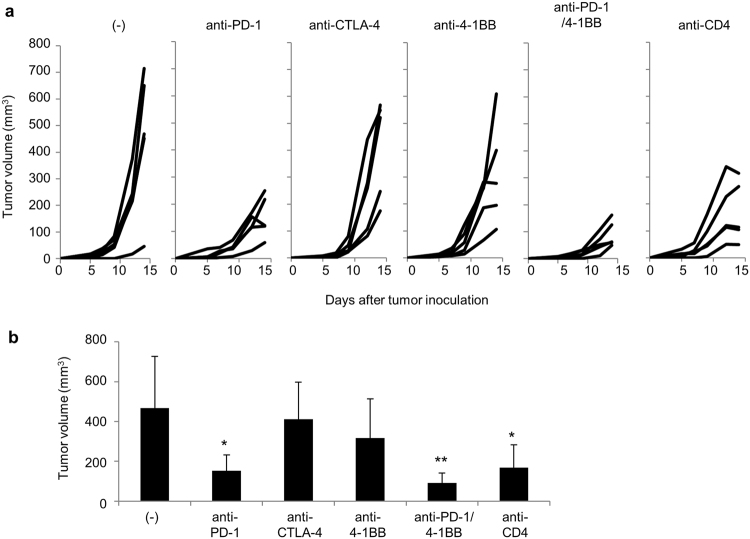
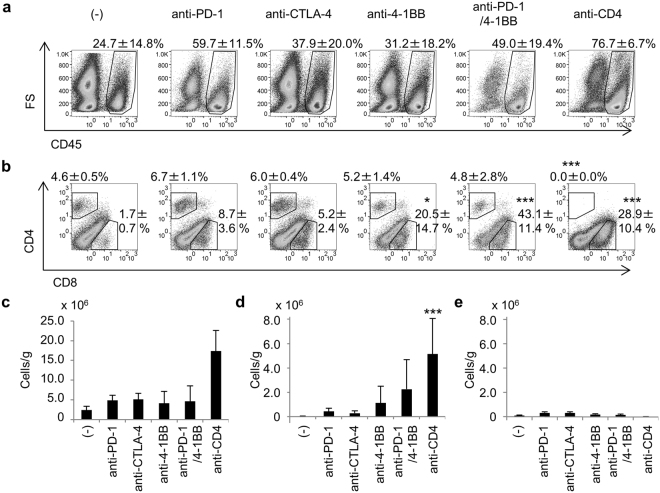
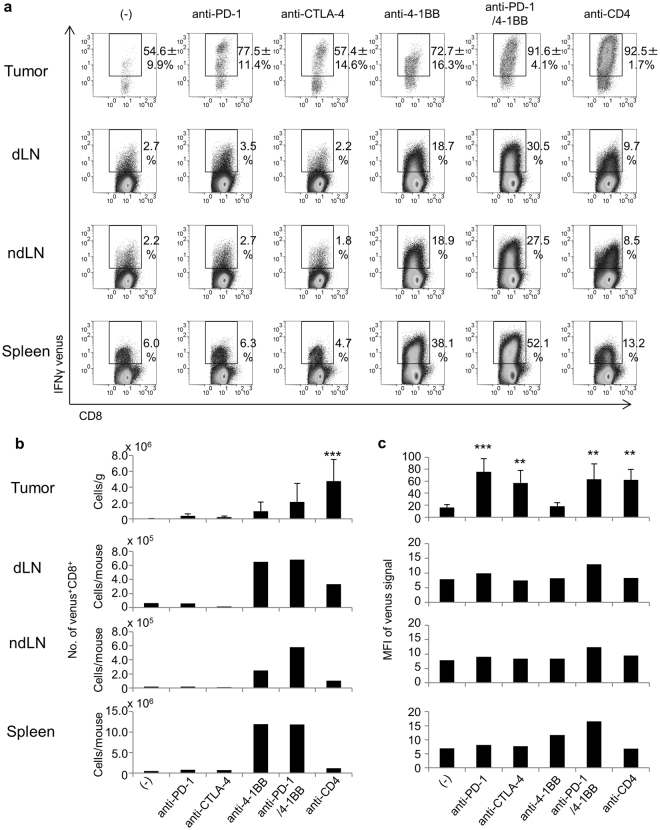
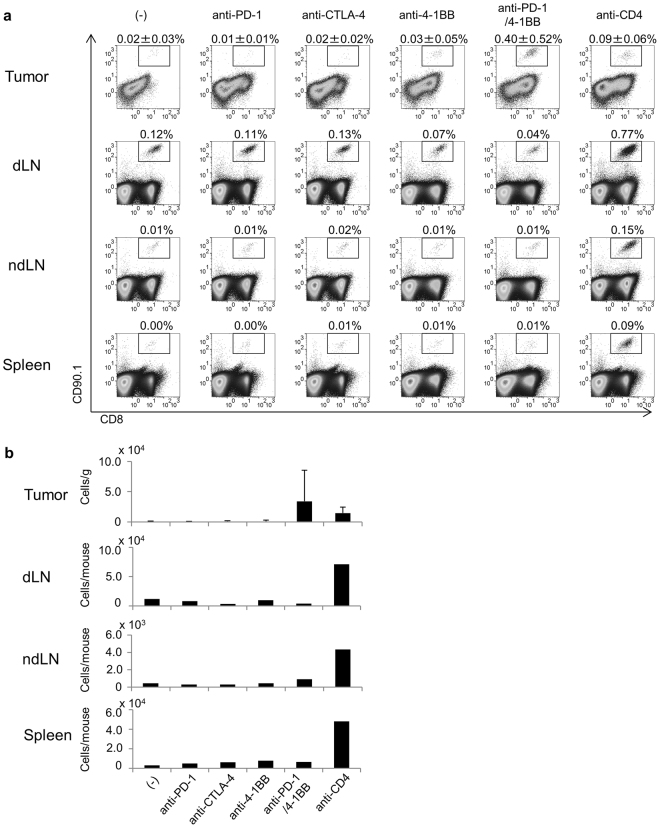
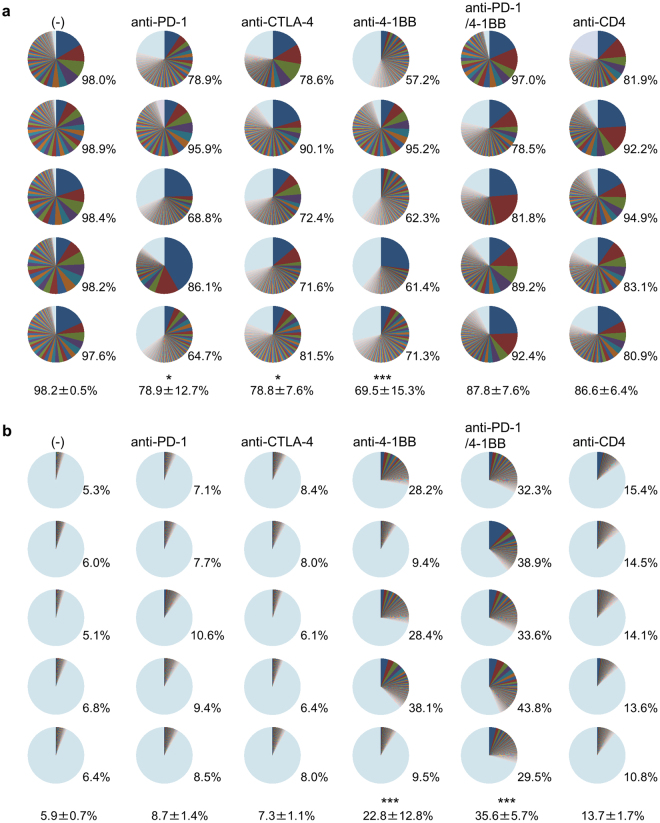
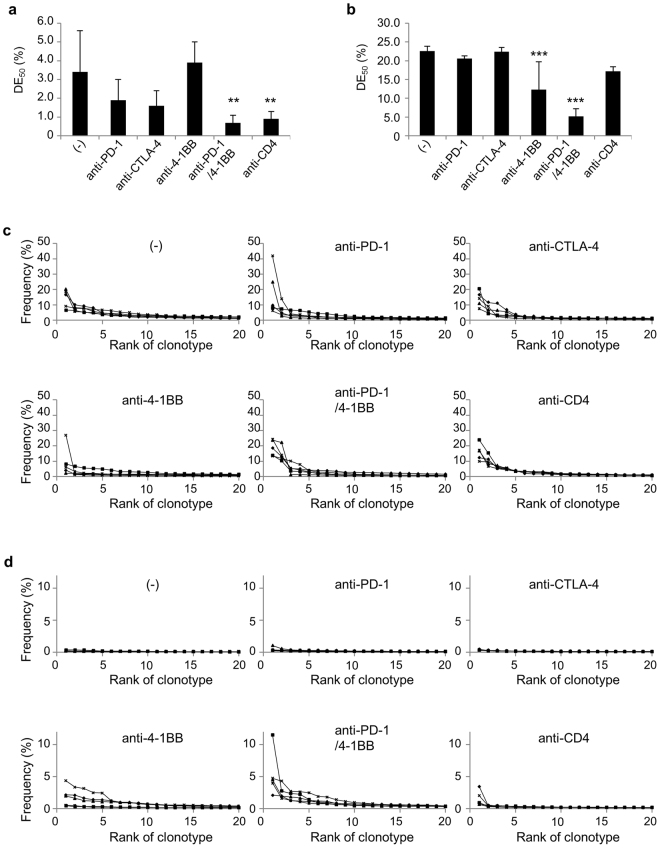
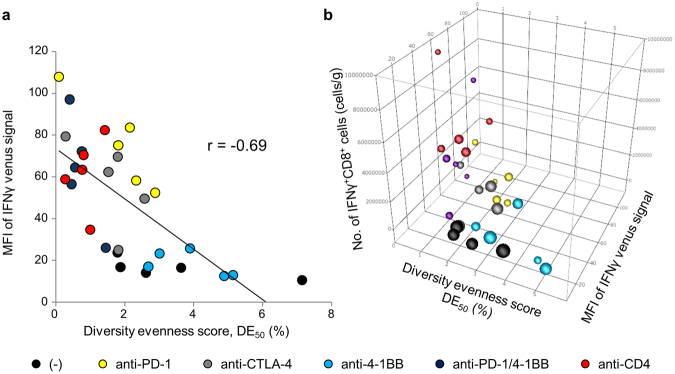
To facilitate the optimization of cancer immunotherapy lacking immune-related adverse events, we performed TCR repertoire analysis of tumor-infiltrating CD8+ T-cells in B16 melanoma-bearing mice receiving anti-PD-1, anti-CTLA-4, anti-4-1BB, anti-CD4 or a combination of anti-PD-1 and 4-1BB antibodies. Although CD8+ T-cells in the tumor were activated and expanded to a greater or lesser extent by these therapies, tumor growth suppression was achieved only by anti-PD-1, anti-PD-1/4-1BB combined, or by anti-CD4 treatment, but not by anti-CTLA-4 or anti-4-1BB monotherapy. Increased CD8+ T cell effector function and TCR diversity with enrichment of certain TCR clonotypes in the tumor was associated with anti-tumor effects. In contrast, polyclonal activation of T-cells in the periphery was associated with tissue damage. Thus, optimal combination therapy increases TCR diversity with extended activation of selective CD8+ T-cells specifically in the tumor but not in the periphery. Incorporation of the concept of evenness for the TCR diversity is proposed.


Conflict of interest statement

The authors declare that they have no competing interests.

Figures

Figure 1
Figure 1
In vivo anti-tumor activity of cancer immunotherapies. (a) IFNγ Venus mice (5 mice per group) were subcutaneously injected with B16 melanoma cells (5 × 105). Tumor volumes were measured every other day. Mice were untreated or given 200 μg of monoclonal antibodies against PD-1, CTLA-4, 4-1BB, CD4 or the combination of anti-PD-1 and anti-4-1BB (anti-PD-1/4-1BB) on days 5 and 9. The graphs show tumor volume of individual mice. (b) Tumor volumes at day 14 were compared. Data are representative of two experiments with 5 mice per group. Dunnett’s test was used for multiple comparisons between control and treatment groups.*p < 0.05, **p < 0.01.
Figure 2
Figure 2
Tumor-infiltrating cells. Mice were treated as described in the legend to Fig. 1. Mice (n = 5) were killed on day 14 and tumor-infiltrating cells were analyzed by flow cytometry. (a) Tumor-infiltrating immune cells detected as viable cell dye Zombie Yellow- CD45+ cells. (b) Percentage of CD8+ and CD4+ cells in the CD45+ population. The number on each panel indicates the mean ± SD of the percentage of indicated cells of 5 mice. The absolute numbers of CD45+ (c), CD8+ (d), and CD4+ (e) cells were calculated as described in the Methods section and adjusted by tumor weight (cells/g). Dunnett’s test was used for multiple comparisons between control and treatment groups (b,d). Steel’s test was used for multiple comparisons between control and treatment groups (a,c,e). ***p < 0.001.
Figure 3
Figure 3
Activation of CD8+ T-cells by immunotherapies. (a) Mice were treated as described in the legend to Fig. 1. Mice (n = 5) were killed on day 14 and the IFNγ venus signal from CD8+ T-cells in the tumor, draining lymph node (dLN), non-draining lymph node (ndLN) and spleen was analyzed by flow cytometry. The number on each panel indicates the mean ± SD of the percentage of venus+ cells among CD8+ T-cells of 5 mice. (b) The absolute numbers of venus+ CD8+ T-cells and (c) mean fluorescent intensities (MFI) of venus signals of these cells were compared. Steel’s test was used for multiple comparisons between control and treatment groups (a). Dunnett’s test was used for multiple comparisons between control and treatment groups (b,c). **p < 0.01, ***p < 0.001.
Figure 4
Figure 4
Activation of tumor-specific (gp100-specific) pmel-1 cells by immunotherapies. To increase the frequency of naive gp100-specific CD8+ T-cells, 5 × 104 CD8+CD90.1+hgp100 tetramer+ cells from pmel-1 transgenic mice were adoptively transferred into IFNγ Venus mice the day before tumor challenge. Mice were then subcutaneously injected with B16 melanoma cells (5 × 105). They were untreated or given 200 μg of monoclonal antibodies against PD-1, CTLA-4, 4-1BB, CD4 or the combination of anti-PD-1 and anti-4-1BB (anti-PD-1/4-1BB) on days 5 and 9. (a) Pmel-1 cells detected in the tumor, dLN, ndLN and spleen as CD8+CD90.1+ cells, showing the percentage of CD90.1+CD8+ T cells in CD45+ cells. (b) Absolute number of pmel-1 cells in these tissues. Steel’s test was used for multiple comparisons between control and treatment groups. (a,b).
Figure 5
Figure 5
Percentage of the top 100 most frequency clones. TRB CDR3 clonotype diversity in the tumor (a) and the spleen (b) shown as pie charts for each of the 5 individual mice. The colors are automatically given by the software and do not correspond to identical TCR clonotypes. The number on the bottom at the right of each panel indicates the cumulative frequency of the top 100 clones of total productive read counts in individual mice. Mean ± SD of 5 mice per group is also indicated at the bottom. Dunnett’s test was used for multiple comparisons between control and treatment groups. *p < 0.05, ***p < 0.001.
Figure 6
Figure 6
Evenness of TRB CDR3 clonotype distribution. Mice were treated as described in the legend to Fig. 4. Groups of mice (n = 5) were killed on day 14 and TCRβ sequencing was performed. Diversity Evenness 50 (DE50) scores of the tumor (a) and the spleen (b) in each indicated treatment were calculated by DE50 = (the number of unique reads that consist of 50% of total read count)/(the total unique read count). All unique CDR3 sequences detected in the tumor (c) and the spleen (d) in each indicated treatment group sorted according to their frequency within the sample, showing that larger clones (left) dominate in the tumor of mice receiving immunotherapies. In mice that received anti-4-1BB mAb, highly enriched T-cell clones were also detected in the spleen. Solid lines indicate each individual mouse. Dunnett’s test was used for multiple comparisons between control and treatment groups. **p < 0.01, ***p < 0.001.
Figure 7
Figure 7
Correlation between TRB CDR3 clonotype diversity in the tumor, T-cell effector function and anti-tumor activities. (a) Diversity Evenness 50 (DE50) scores on the x-axis versus MFI values of IFNγ venus signal on the y-axis. Each dot indicates individual mice receiving no treatment (black circles), anti-PD-1(yellow), anti-CTLA-4 (grey), anti-4-1BB (blue), combination of anti-PD-1 and 4-1BB (purple) or anti-CD4 mAb (red). (b) Relationship between Diversity Evenness 50 (DE50) scores, MFI values of IFNγ venus signal, the number of IFNγ+CD8+ cells in the tumor (cells/gram) and the tumor volume. The size of the circle indicates the tumor volume.

References

    1. Hodi FS, et al. Improved survival with ipilimumab in patients with metastatic melanoma. The New England journal of medicine. 2010;363:711–723. doi: 10.1056/NEJMoa1003466. - DOI - PMC - PubMed
    1. Topalian SL, et al. Safety, activity, and immune correlates of anti-PD-1 antibody in cancer. The New England journal of medicine. 2012;366:2443–2454. doi: 10.1056/NEJMoa1200690. - DOI - PMC - PubMed
    1. Sharma P, Allison JP. The future of immune checkpoint therapy. Science (New York, N.Y.) 2015;348:56–61. doi: 10.1126/science.aaa8172. - DOI - PubMed
    1. Callahan MK, Postow MA, Wolchok JD. Targeting T Cell Co-receptors for Cancer Therapy. Immunity. 2016;44:1069–1078. doi: 10.1016/j.immuni.2016.04.023. - DOI - PubMed
    1. Topalian SL, Drake CG, Pardoll DM. Immune checkpoint blockade: a common denominator approach to cancer therapy. Cancer cell. 2015;27:450–461. doi: 10.1016/j.ccell.2015.03.001. - DOI - PMC - PubMed

Publication types

MeSH terms

Substances