. 2018 Jan 18;9(1):287.
doi: 10.1038/s41467-017-02562-5.

A biosensor-based framework to measure latent proteostasis capacity

Affiliations

A biosensor-based framework to measure latent proteostasis capacity

Rebecca J Wood et al. Nat Commun. .

Abstract

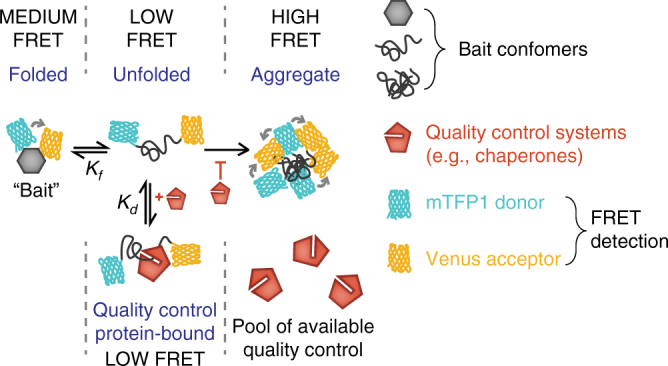
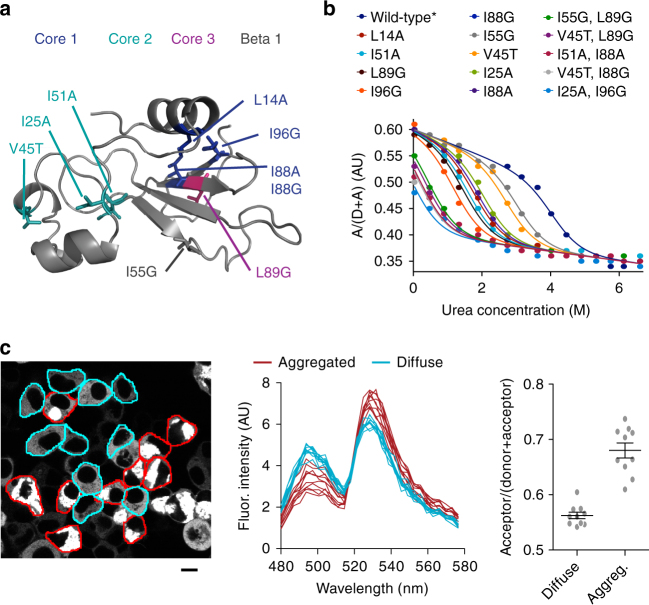
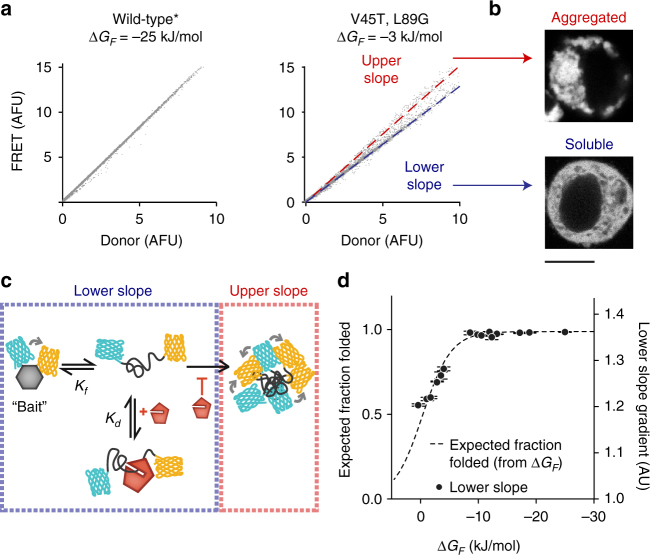
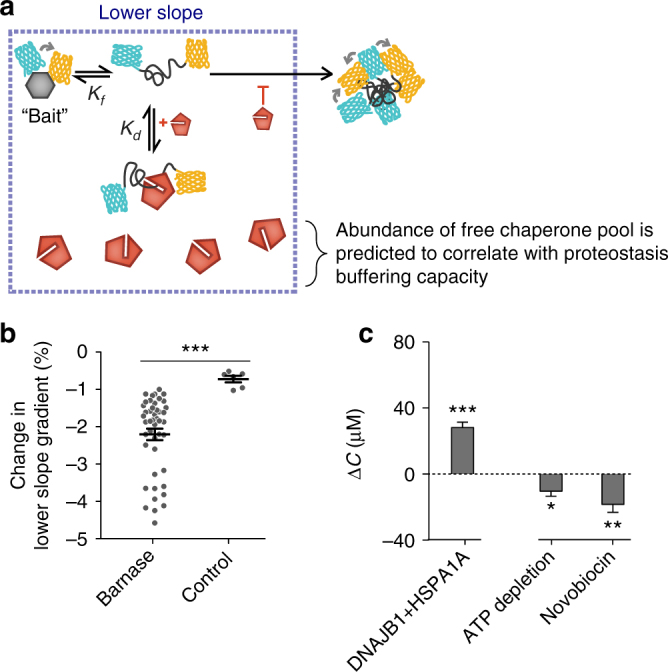
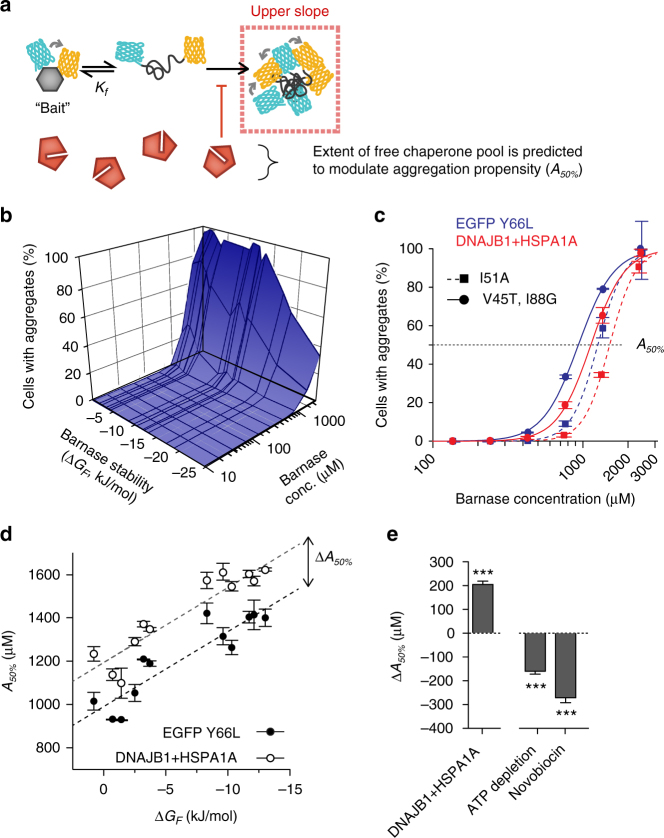
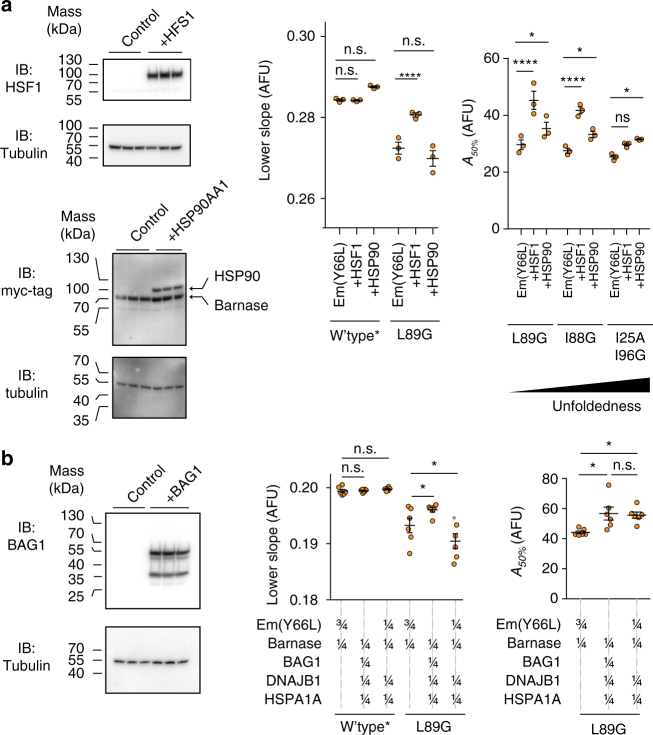
The pool of quality control proteins (QC) that maintains protein-folding homeostasis (proteostasis) is dynamic but can become depleted in human disease. A challenge has been in quantitatively defining the depth of the QC pool. With a new biosensor, flow cytometry-based methods and mathematical modeling we measure the QC capacity to act as holdases and suppress biosensor aggregation. The biosensor system comprises a series of barnase kernels with differing folding stability that engage primarily with HSP70 and HSP90 family proteins. Conditions of proteostasis stimulation and stress alter QC holdase activity and aggregation rates. The method reveals the HSP70 chaperone cycle to be rate limited by HSP70 holdase activity under normal conditions, but this is overcome by increasing levels of the BAG1 nucleotide exchange factor to HSPA1A or activation of the heat shock gene cluster by HSF1 overexpression. This scheme opens new paths for biosensors of disease and proteostasis systems.


Conflict of interest statement

The authors declare no competing financial interests.

Figures

Fig. 1
Fig. 1
Design strategy for probing proteostasis efficiency. Scheme of how the bait biosensor module measures collective cellular chaperone engagement by binding to unfolded barnase and in preventing aggregation. Medium FRET and low FRET: binding of quality control machinery to barnase bait pulls the equilibrium away from folded barnase, reducing the FRET signal in the soluble pool. High FRET: quality control systems reduce aggregate accumulation, thereby reducing the number of cells with high-FRET
Fig. 2
Fig. 2
FRET reports on barnase foldedness and aggregation. a Bait protein barnase structure is shown (PDB ID 1A2P) with the location of destabilizing mutations used to tune Kf (and thus ΔGF). b Urea denaturation curves, assayed by FRET, are shown of barnase constructs expressed in mammalian lysate fitted to a two-state unfolding model (one representative replicate per mutant of n = 3). c A confocal micrograph image of representative cells expressing a destabilized barnase variant (I25A, I96G) in HEK293T cells. Scale bar=10 µm. The wild-type barnase variant does not form visible aggregates. The middle graph shows fluorescence spectra (excitation 405 nm) for cells with only diffuse biosensor vs. cells with visible aggregates. The right graph shows a proxy measure for FRET of these cells (means ± SEM)
Fig. 3
Fig. 3
Barnase foldedness and aggregation can be readily assessed by flow cytometry. a Flow cytometry analysis to determine FRET. Data points indicate fluorescence signatures of individual cells for donor and FRET channels. b Representative confocal images of cells recovered by cell sorting (scale bar=10 µm; “Soluble” image scaled at 4×brightness vs. “Aggregated”). c Conceptual framework for how flow cytometry data reports on foldedness vs. aggregation d The Lower-slope gradients of barnase mutants measured by flow cytometry (right axis) follows the expected relationship between stability (ΔGF) and fraction folded (left axis, scaled to fit). Each data point reflects one barnase mutant (mean ± SD; three replicates). Note that the AFU or AU scales, while arbitrary, cannot be compared between different panels and figures due to changes in instrument calibration settings
Fig. 4
Fig. 4
Quantifying proteostasis by changes in latent chaperone concentration available for holdase activity (ΔC). a Conceptual framework for how chaperone levels affect barnase foldedness. b Changes in Lower-slope gradients of the barnase mutants (data points show individual replicates of each mutant) vs. a FRET-positive negative control (mTFP1 cp175-Venus cp173 fusion lacking the barnase kernel; data points show individual replicates) when co-expressed with HSP40 and HSP70 chaperones (DNAJB1 and HSPA1A respectively) relative to baseline conditions (Y66L EGFP co-expression). Means ± SEM shown. c Effect of toggling proteostasis on changes in available chaperone capacity (ΔC). Plots show means ± SEM of the 12 barnase mutants when coexpressed with DNAJB1 and HSPA1A (compared to Y66L EGFP control; left panel), or treated with proteostasis-modulating drugs (compared to untreated control). Wilcoxon signed rank tests results coded as ***p < 0.001, **p < 0.01, *p < 0.05
Fig. 5
Fig. 5
Quantifying proteostasis by changes in biosensor aggregation propensity (A50%). a Conceptual framework for how chaperone levels affect barnase-biosensor aggregation. b Baseline barnase aggregation “landscape” in cells as measured by the proportion of cells in the Upper-slope flow cytometry population. Data show mean of three replicates for each barnase mutant coexpressed with Y66L EGFP control. c Impact on chaperone overexpression on aggregation landscape. Data shows two of the barnase mutants and corresponding treatment regimes. Data points are means ± SD of three replicates. Chaperone treatment vs. control, p < 0.0001, extra sum-of-squares F test. d Impact of chaperone overexpression on A50% values. Each data point reflects one mutant (means ± SEM of three replicates). Lines show linear regressions with same slope (preferred model by extra sum of squares F-test, p = 0.57). ΔA50% is the translational offset, calculated for each mutant (example indicated by arrow). e Impact of proteostasis on changes in A50%A50%). Data show chaperone co-expression (compared to Y66L EGFP negative control), treatment with proteostasis-modulating drugs (compared to untreated control). Data are means ± SEM of 12 mutants of barnase. Results of Wilcoxon signed rank test are shown: Results coded as ***p < 0.001
Fig. 6
Fig. 6
Probing changes in proteostasis through selective activation of different chaperone systems. a Investigation of the effect of induction of the heat shock response by HSF1 overexpression or selective overexpression of HSP90. Shown on left are western blots of the HEK293T cells matched for total protein via a BCA assay. These cells were co-transfected with HSF1 (or myc-tagged HSP90 or control of (non-fluorescent) Y66L Emerald fluorescent protein) and the L89G barnase biosensor (which also contains a myc tag). The right graphs show the Lower-slope and A50% analyses of these treatments and one or three of the biosensor variants as indicated vs. the wild-type* variant. Bars indicate means ± SEM. The right panels were analysed via a two-way ANOVA subjected to a Dunnett’s post-hoc test, results coded as ****p < 0.0001, ***p < 0.001, **p < 0.01, *p < 0.05, ns = > 0.05. b Same paradigm as panel a. In this case, BAG1 was cotransfected with the barnase biosensor, HSP40 (DNAJB1) and HSP70 (HSPA1A). The right panels show the proportional dosage of each construct (by mass of DNA) in the transfection. Bars indicate means ± SEM. The right panel Lower-slope graph was analysed via a two-way ANOVA subjected to Dunnett’s post hoc test and the A50% graph was analysed via a one-way ANOVA subjected to a Tukey’s post-hoc test. Results coded as ****p < 0.0001, ***p < 0.001, **p < 0.01, *p < 0.05, ns = > 0.05

References

    1. Hartl FU, Bracher A, Hayer-Hartl M. Molecular chaperones in protein folding and proteostasis. Nature. 2011;475:324–332. doi: 10.1038/nature10317. - DOI - PubMed
    1. Schneider K, Bertolotti A. Surviving protein quality control catastrophes – from cells to organisms. J. Cell. Sci. 2015;128:3861–3869. doi: 10.1242/jcs.173047. - DOI - PubMed
    1. Gidalevitz T, Ben-Zvi A, Ho KH, Brignull HR, Morimoto RI. Progressive disruption of cellular protein folding in models of polyglutamine diseases. Science. 2006;311:1471–1474. doi: 10.1126/science.1124514. - DOI - PubMed
    1. Gupta R, et al. Firefly luciferase mutants as sensors of proteome stress. Nat. Methods. 2011;8:879–U155. doi: 10.1038/nmeth.1697. - DOI - PubMed
    1. Liu Y, Zhang X, Chen W, Tan YL, Kelly JW. Fluorescence turn-on folding sensor to monitor proteome stress in live cells. J. Am. Chem. Soc. 2015;137:11303–11311. doi: 10.1021/jacs.5b04366. - DOI - PMC - PubMed

Publication types

LinkOut - more resources