. 2018 Jan 18;9(1):292.
doi: 10.1038/s41467-017-02113-y.

Enhancer-associated long non-coding RNA LEENE regulates endothelial nitric oxide synthase and endothelial function

Affiliations

Enhancer-associated long non-coding RNA LEENE regulates endothelial nitric oxide synthase and endothelial function

Yifei Miao et al. Nat Commun. .

Abstract

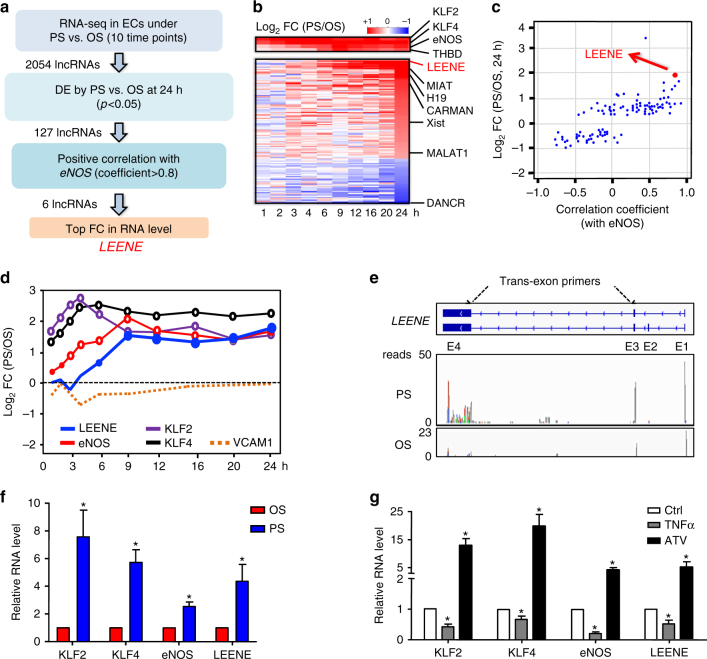
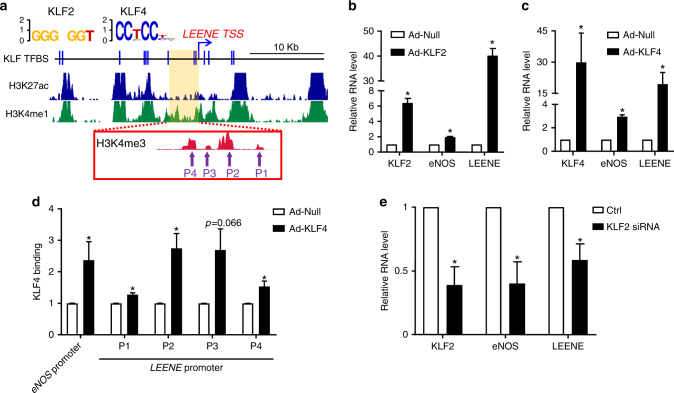
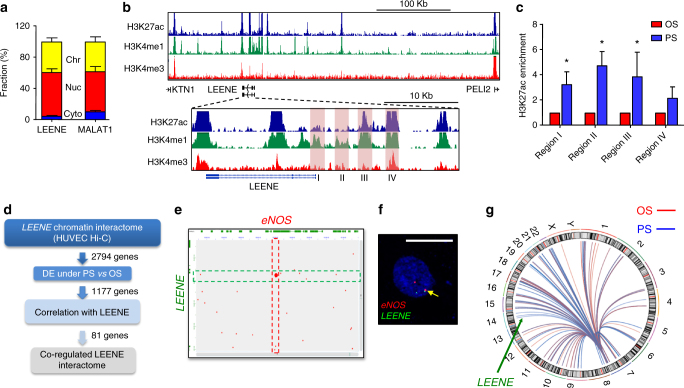
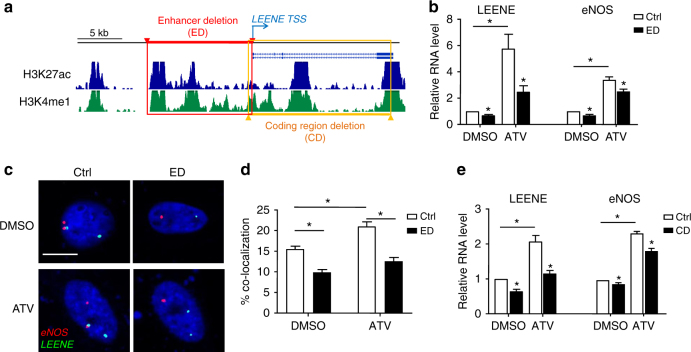
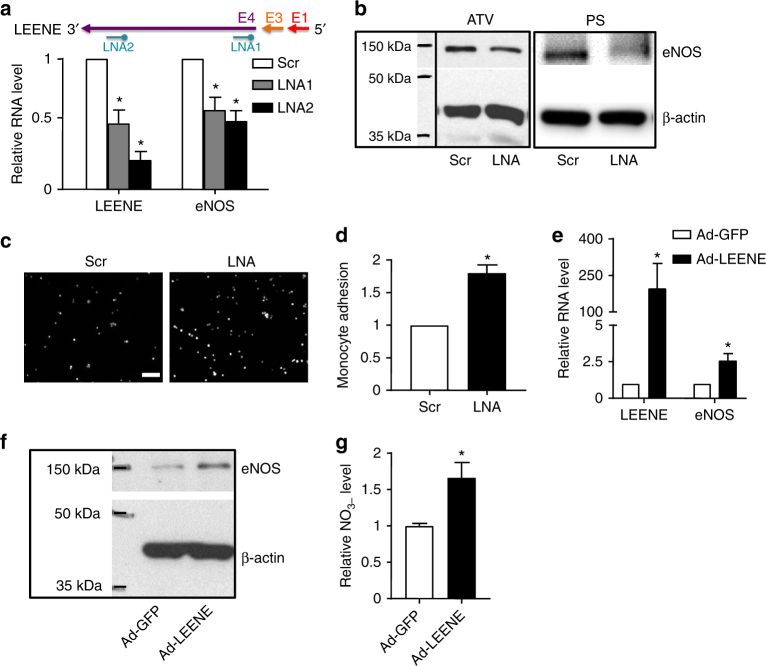
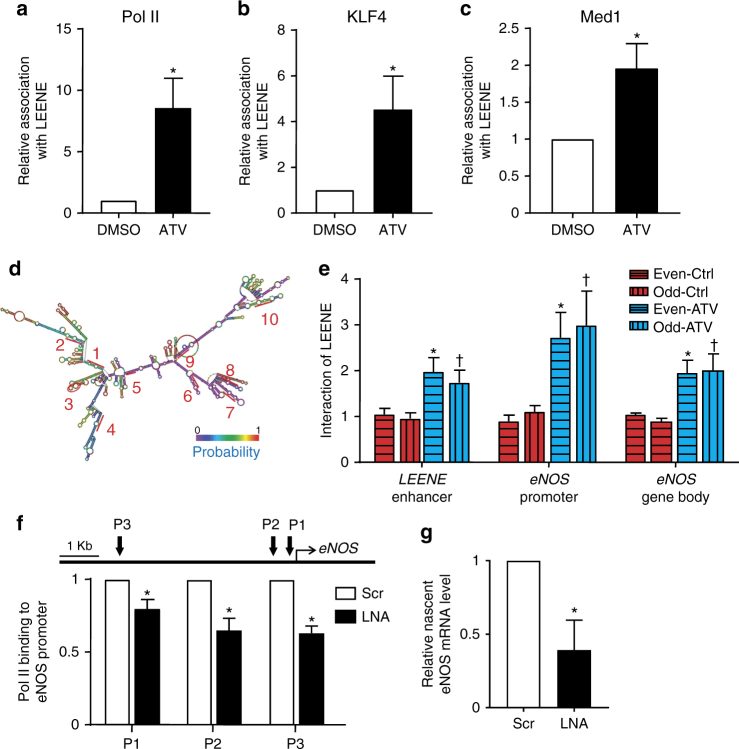
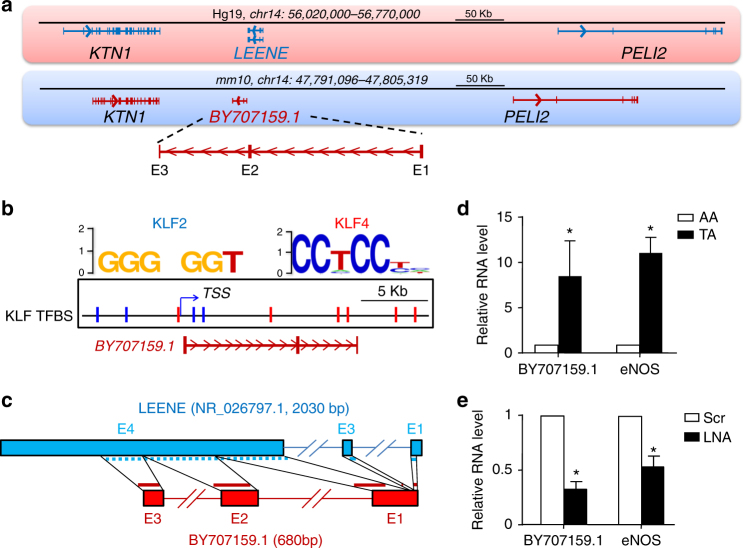
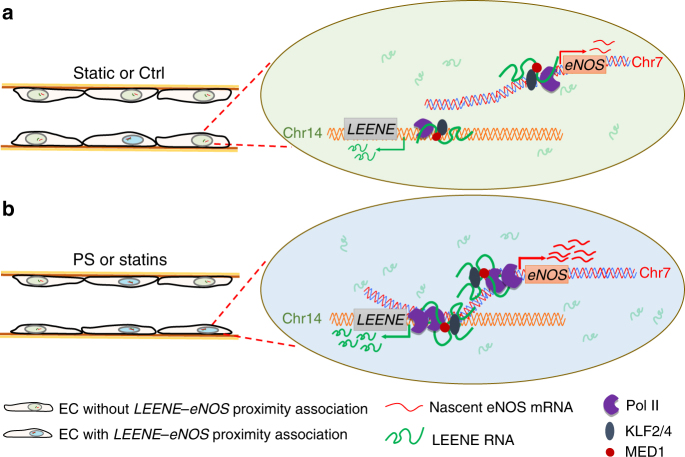
The optimal expression of endothelial nitric oxide synthase (eNOS), the hallmark of endothelial homeostasis, is vital to vascular function. Dynamically regulated by various stimuli, eNOS expression is modulated at transcriptional, post-transcriptional, and post-translational levels. However, epigenetic modulations of eNOS, particularly through long non-coding RNAs (lncRNAs) and chromatin remodeling, remain to be explored. Here we identify an enhancer-associated lncRNA that enhances eNOS expression (LEENE). Combining RNA-sequencing and chromatin conformation capture methods, we demonstrate that LEENE is co-regulated with eNOS and that its enhancer resides in proximity to eNOS promoter in endothelial cells (ECs). Gain- and Loss-of-function of LEENE differentially regulate eNOS expression and EC function. Mechanistically, LEENE facilitates the recruitment of RNA Pol II to the eNOS promoter to enhance eNOS nascent RNA transcription. Our findings unravel a new layer in eNOS regulation and provide novel insights into cardiovascular regulation involving endothelial function.


Conflict of interest statement

The authors declare no competing financial interests.

Figures

Fig. 1
Fig. 1
Co-regulation of LEENE and eNOS. a LEENE discovery pipeline. b Heatmap of RNA levels of flow-regulated lncRNAs derived from RNA-seq. c Scatter plot of the flow-regulated lncRNAs ranked by differential expression (DE) fold change (FC) at 24 h (PS/OS) and correlation with eNOS mRNA level. d Time course of log2FC of mRNAs encoding various genes. e Structure of LEENE gene encoding two RNA transcripts. Trans-exon primers used in qPCR were designed to amplify fragments flanking Exons 3 and 4. RNA-seq tracks depicting abundance of LEENE in ECs under PS or OS for 24 h. f, g qPCR detection of various RNA transcripts in ECs subjected to PS or OS (in f) or TNFα (100 ng per ml) or atorvastatin (ATV) (1 μM) (in g) for 24 h. Data are presented as mean ± SEM, n = 5 in each group. *p < 0.05 compared to OS (in f, based on Student’s t test) or ctrl (in g, calculated by ANOVA followed by Bonferroni post test)
Fig. 2
Fig. 2
KLF2 and KLF4 transcriptionally regulate LEENE. a Putative KLF2 and KLF4 binding sites in LEENE enhancer/promoter based on the conserved KLF2 and KLF4 binding motifs (shown on the top). Middle tracks display H3K27ac and H3K4me1 ChIP-seq signals in LEENE locus, and the inset shows H3K4me3 ChIP-seq signals in the putative LEENE promoter region from ENCODE HUVEC data; arrows indicate regions detected in ChIP-qPCR (Fig. 2d). bd HUVECs were infected with respective adenoviruses for 48 h. RNA levels of KLF2, KLF4, LEENE, and eNOS were detected by qPCR (in b and c) and KLF4 binding to promoters of eNOS and LEENE was quantified by ChIP-qPCR analysis (in d). e qPCR of respective RNA levels in ECs transfected with scramble control (Ctrl) or KLF2 siRNA. Data are presented as mean ± SEM, n = 5 in each group. *p < 0.05 compared to respective controls using Student’s t test
Fig. 3
Fig. 3
LEENE RNA is nucleus-localized and its DNA lies in enhancer region interacting with eNOS promoter. a qPCR quantitation of LEENE and MALAT1 in subcellular fractions from ECs, plotted as percentages in association with chromatin (Chr), nucleoplasm (Nuc), and cytoplasm (Cyt). b ENCODE HUVEC ChIP-seq signals in 400 kb (top tracks) and 50 kb (bottom tracks) regions surrounding LEENE. Regions in shades were selected for H3K27ac ChIP-qPCR in c. d Flow chart of integrative Hi-C and RNA-seq analyses. e LEENEeNOS interaction map generated from GEO HUVEC Hi-C analysis. Red pixels represent interactions between two regions, respectively, in chr7 (X-axis) and chr14 (Y-axis). The highlighted regions correspond to eNOS promoter and LEENE enhancer regions. f Representative image of DNA FISH with respective probes recognizing LEENE and eNOS genomic loci. Arrow indicates proximity association between two loci. Scale bar = 10 μm. g 4C-seq mapping of inter-chromosomal interactions between eNOS bait (249 bp) and lncRNAs listed in Fig. 1b. Each line in the circoplot represents an interaction and the color intensity reflects the normalized reads of ligated DNA ends. Chromosomes are numbered around the circle. Data are presented as mean ± SEM, n = 5 in each group. *p < 0.05 compared to OS based on Student’s t test
Fig. 4
Fig. 4
Gene editing of LEENE locus influences eNOS transcription. a Schematic illustration of CRISPR-Cas9 targeting strategy. Regions in red and orange indicate, respectively, the upstream enhancer/promoter region or the coding region deleted by sgRNA-guided Cas9, resulting in enhancer deletion (ED) and coding region deletion (CD) in LEENE locus. b LEENE and eNOS RNA levels in ECs transfected with control Cas9 plasmid (Ctrl) or “ED” Cas9-sgRNAs were quantified using qPCR. c DNA FISH for proximity association of LEENE and eNOS genomic loci. ECs transfected with control (Ctrl) or “ED” Cas9-sgRNAs were treated with DMSO or ATV (1 μM) for 24 h. Scale bar = 10 μm. d Percentage of cells with LEENE and eNOS proximity association (distance <1 μm). n = 678 in “DMSO-Ctrl” group; n = 425 in “DMSO-ED” group; n = 632 in “ATV-Ctrl” group; n = 581 in “ATV-ED” group. e qPCR quantification of LEENE and eNOS RNA levels in ECs transfected with control Cas9 (Ctrl) or “CD” Cas9-sgRNAs. All data are presented as mean ± SEM. n = 5 in each group unless specified. *p < 0.05 compared with “Ctrl” or between indicated groups based on Student’s t test
Fig. 5
Fig. 5
LEENE RNA regulates eNOS expression and EC function. ae HUVECs were transfected with LNA (50 nM) targeting Exon 4 of LEENE. Basal RNA levels of LEENE and eNOS were detected by qPCR in a. Protein levels of eNOS in HUVECs treated with ATV or PS were revealed by immunoblotting. c, d ECs were transfected with scramble or LEENE LNA before subjected to PS for 12 h. Fluorescence-labeled THP-1 cells were added to the EC monolayer, and the monocytes adhering to ECs were visualized by fluorescence microscopy (scale bar = 100 μm). The representative images are shown in c and the quantification based on five randomly selected fields per group per experiment are shown in d. eg HUVECs were infected with Ad-GFP or Ad-LEENE for 48 h. RNA levels of LEENE and eNOS were detected by qPCR (e), protein level of eNOS in HUVECs was revealed by immunoblotting (f), and NO production was measured by a fluorometric assay (g). Densitometry analysis of immunoblotting shown in b and f was performed (Supplementary Fig. 9). Data are presented as mean ± SEM. n = 3–5 in each group. Student’s t test was used. *p < 0.05 compared to scrambled control or Ad-GFP in respective experiments
Fig. 6
Fig. 6
LEENE RNA promotes RNA Pol II binding and eNOS transcription. ac, e HUVECs were treated with ATV for 24 h. The binding of RNA Pol II, KLF4, and MED1 to LEENE RNA was determined by RIP followed by qPCR (ac). d Predicted secondary structure of LEENE RNA based on minimum free energy (MFE) and fragments complementary to ChIRP probes are labeled with numbers 1–10. Color scale shows the probabilities for every nucleotide to hold the structural position. Following ChIRP, interactions between LEENE RNA and respective DNA regions of LEENE and eNOS were detected by qPCR (in e). f, g Static ECs were transfected with scramble or LEENE LNA. The binding of RNA Pol II to eNOS promoter was determined by ChIP-qPCR with three primer sets flanking three regions upstream of eNOS TSS (in f). g Nascent RNA was captured in static ECs transfected with scramble or LEENE LNA. eNOS mRNA level was detected by qPCR. Data are presented as mean ± SEM, n = 5 in each group. *p < 0.05 compared with respective control in each experiment. In ac, * denotes p < 0.05 compared with DMSO; in e, * indicates p < 0.05 between Ctrl and ATV using even-numbered probes; † denotes p < 0.05 between Ctrl and ATV using odd-numbered probes; in f and g, * means p < 0.05 between scramble vs. LNA groups. Student’s t test was applied
Fig. 7
Fig. 7
LEENE homolog in mouse. a Comparison of human LEENE and mouse BY707159.1 loci. b Putative KLF2/4 TFBS in DNA region encoding BY707159.1, indicated by blue (for KLF2) and red (for KLF4). c Sequence alignment between human LEENE and BY707159.1. d Measurement of BY707159.1 RNA levels in thoracic aorta (TA) and aortic arch (AA) using qPCR. e qPCR of BY707159.1 and eNOS RNA level in isolated mouse lung ECs transfected with scramble or LEENE LNA. In each experiment, lungs from four animals were pooled for isolation and transfection. Data are average from four independent experiments. Error bars present mean ± SEM. *p < 0.05 between AA and TA in d and between scramble and LNA in e based on Student’s t test
Fig. 8
Fig. 8
Schematic illustration of LEENE–eNOS regulatory mechanism. The LEENE-associated enhancer (located in chr14) forms proximity association with eNOS locus (in chr7) under both static/basal/control (ctrl) (a) and stimulated conditions (PS or statins) (b), but is at a higher probability in the latter condition. In both conditions, KLF2 and KLF4 transcriptionally regulate LEENE and eNOS through binding to TFBS in the promoters of both genes. The LEENE RNA transcripts serve as guides to facilitate RNA Pol II binding to the promoter of eNOS. This enhancer lncRNA-mediated transcriptional regulation positively modulates the nascent eNOS mRNA synthesis to promote endothelial function

References

    1. Forstermann U, Sessa WC. Nitric oxide synthases: regulation and function. Eur. Heart J. 2012;33:829–837. doi: 10.1093/eurheartj/ehr304. - DOI - PMC - PubMed
    1. Fulton D, et al. Regulation of endothelium-derived nitric oxide production by the protein kinase Akt. Nature. 1999;399:597–601. doi: 10.1038/21218. - DOI - PMC - PubMed
    1. Chen Z, et al. Shear stress, SIRT1, and vascular homeostasis. Proc. Natl Acad. Sci. USA. 2010;107:10268–10273. doi: 10.1073/pnas.1003833107. - DOI - PMC - PubMed
    1. Shaul PW. Regulation of endothelial nitric oxide synthase: location, location, location. Annu. Rev. Physiol. 2002;64:749–774. doi: 10.1146/annurev.physiol.64.081501.155952. - DOI - PubMed
    1. Sangwung P, et al. KLF2 and KLF4 control endothelial identity and vascular integrity. JCI Insight. 2017;2:e91700. doi: 10.1172/jci.insight.91700. - DOI - PMC - PubMed

Publication types

MeSH terms

Substances