

Trends in social inequality in physical inactivity among Danish adolescents 1991-2014
- PMID: 29349244
- PMCID: PMC5769051
- DOI: 10.1016/j.ssmph.2017.04.003
Trends in social inequality in physical inactivity among Danish adolescents 1991-2014
Abstract
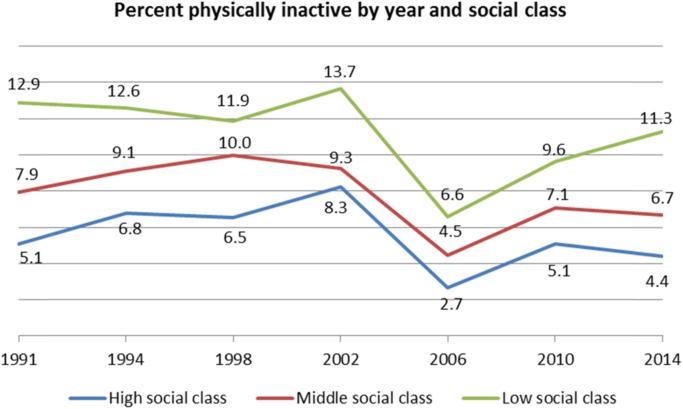
The aim of this study was to investigate social inequality in physical inactivity among adolescents from 1991 to 2014 and to describe any changes in inequality during this period. The analyses were based on data from the Danish part of the HBSC study, which consists of seven comparable cross-sectional studies of nationally representative samples of 11-15-year old adolescents. The available data consisted of weekly time (hours) spent on vigorous physical activity and parental occupation from 30,974 participants. In summary, 8.0% of the adolescents reported to be physically inactive, i.e. spend zero hours of vigorous leisure time physical activity per week. The proportion of physically inactive adolescents was 5.4% in high social class and 7.8% and 10.8%, respectively, in middle and low social class. The absolute social inequality measured as prevalence difference between low and high social class did not change systematically across the observation period from 1991 to 2014. Compared to high social class, OR (95% CI) for physical inactivity was 1.48 (1.32-1.65) in middle social class and 2.18 (1.92-2.47) in lower social class. This relative social inequality was similar in the seven data collection waves (p=0.971). Although the gap in physical inactivity between social classes does not seem to be widening in Danish adolescents, there are still considerable differences in the activity levels between high, middle and low social class adolescents. Consequently, there is a need for a targeted physical activity intervention among adolescents from low (and middle) social class.
Keywords: Adolescents; Children; Physical inactivity; Social inequality; Trend.
Figures
References
-
- Agresti A. Second Edition. John Wiley; New York: 2002. Categorical data analysis.
-
- Biddle S.J., Asare M. Physical activity and mental health in children and adolescents: A review of reviews. British Journal of Sports Medicine. 2011;45:886–895. - PubMed
-
- Booth V.M., Rowlands A.V., Dollman J. Physical activity temporal trends among children and adolescents. Journal of Science and Medicine. 2015;18:418–425. - PubMed
LinkOut - more resources
Full Text Sources
Other Literature Sources
Miscellaneous
