Changes in seasonal snow water equivalent distribution in High Mountain Asia (1987 to 2009)
- PMID: 29349294
- PMCID: PMC5771697
- DOI: 10.1126/sciadv.1701550
Changes in seasonal snow water equivalent distribution in High Mountain Asia (1987 to 2009)
Abstract
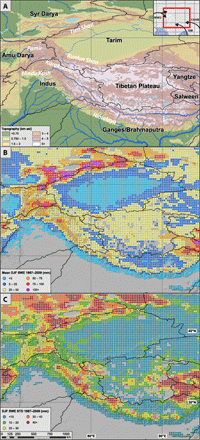
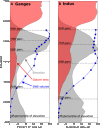
Snow meltwaters account for most of the yearly water budgets of many catchments in High Mountain Asia (HMA). We examine trends in snow water equivalent (SWE) using passive microwave data (1987 to 2009). We find an overall decrease in SWE in HMA, despite regions of increased SWE in the Pamir, Kunlun Shan, Eastern Himalaya, and Eastern Tien Shan. Although the average decline in annual SWE across HMA (contributing area, 2641 × 103 km2) is low (average, -0.3%), annual SWE losses conceal distinct seasonal and spatial heterogeneities across the study region. For example, the Tien Shan has seen both strong increases in winter SWE and sharp declines in spring and summer SWE. In the majority of catchments, the most negative SWE trends are found in mid-elevation zones, which often correspond to the regions of highest snow-water storage and are somewhat distinct from glaciated areas. Negative changes in SWE storage in these mid-elevation zones have strong implications for downstream water availability.
Figures


References
-
- Bolch T., Kulkarni A., Kääb A., Huggel C., Paul F., Cogley J. G., Frey H., Kargel J. S., Fujita K., Scheel M., Bajracharya S., Stoffel M., The state and fate of Himalayan glaciers. Science 336, 310–314 (2012). - PubMed
-
- Kääb A., Berthier E., Nuth C., Gardelle J., Arnaud Y., Contrasting patterns of early twenty-first-century glacier mass change in the Himalayas. Nature 488, 495–498 (2012). - PubMed
-
- Kang S., Xu Y., You Q., Flügel W.-A., Pepin N.; Yao T., Review of climate and cryospheric change in the Tibetan Plateau. Environ. Res. Lett. 5, 015101 (2010).
-
- Immerzeel W. W., Van Beek L. P., Bierkens M. F., Climate change will affect the asian water towers. Science 328, 1382–1385 (2010). - PubMed
-
- Gardner A. S., Moholdt G., Cogley J. G., Wouters B., Arendt A. A., Wahr J., Berthier E., Hock R., Pfeffer W. T., Kaser G., Ligtenberg S. R. M., Bolch T., Sharp M. J., Hagen J. O., van den Broeke M. R., Paul F., A reconciled estimate of glacier contributions to sea level rise: 2003 to 2009. Science 340, 852–857 (2013). - PubMed
Publication types
LinkOut - more resources
Full Text Sources
Other Literature Sources

