

Review
doi: 10.1002/psp4.12282.
Epub 2018 Feb 1.
Preclinical QSP Modeling in the Pharmaceutical Industry: An IQ Consortium Survey Examining the Current Landscape
Affiliations
- PMID: 29349875
- PMCID: PMC5869550
- DOI: 10.1002/psp4.12282
Item in Clipboard
Review
Preclinical QSP Modeling in the Pharmaceutical Industry: An IQ Consortium Survey Examining the Current Landscape
CPT Pharmacometrics Syst Pharmacol.
2018 Mar.
Abstract
A cross-industry survey was conducted to assess the landscape of preclinical quantitative systems pharmacology (QSP) modeling within pharmaceutical companies. This article presents the survey results, which provide insights on the current state of preclinical QSP modeling in addition to future opportunities. Our results call attention to the need for an aligned definition and consistent terminology around QSP, yet highlight the broad applicability and benefits preclinical QSP modeling is currently delivering.
© 2018 The Authors CPT: Pharmacometrics & Systems Pharmacology published by Wiley Periodicals, Inc. on behalf of American Society for Clinical Pharmacology and Therapeutics.
Figures
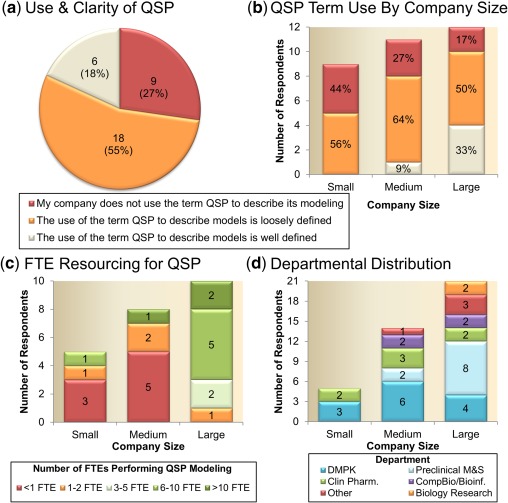
Quantitative systems pharmacology (QSP) modeling definition and resourcing. Use of QSP modeling across all surveyed pharmaceutical companies (a) show a significant number of companies (27%) do not use the term QSP to describe any of their modeling activities. When stratified based on company size (b) mid to large pharmaceutical companies were more likely to describe some of their modeling activities as QSP; however, the majority of companies, independent of size, had a loose definition of QSP. (c) A positive correlation was demonstrated between company size and QSP modeler full time equivalent (FTE) employee resource. (d) Departmental distribution of preclinical QSP modelers. Company size is defined as: small = <2,000 employees; medium = 2,000–10,000; and large = >10,000 employees. DMPK, drug metabolism and pharmacokinetics; M&S, modeling and simulation.
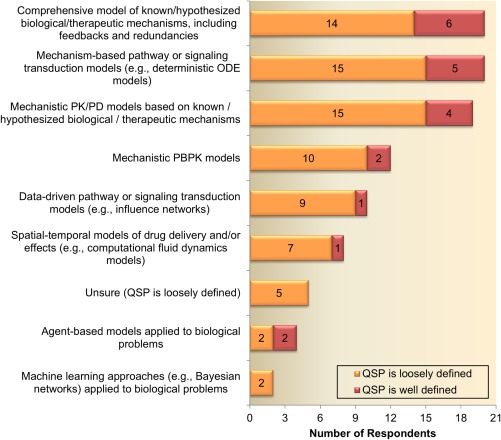
Modeling approaches considered as quantitative systems pharmacology (QSP) Models. Response patterns were comparable between Pharmaceutical companies with a clear and loose definition of QSP, highlighting the need for better education and definition of QSP in the modeling community. ODE, ordinary differential equation; PBPK, physiologically based pharmacokinetic; PK/PD, pharmacokinetic/pharmacodynamic.
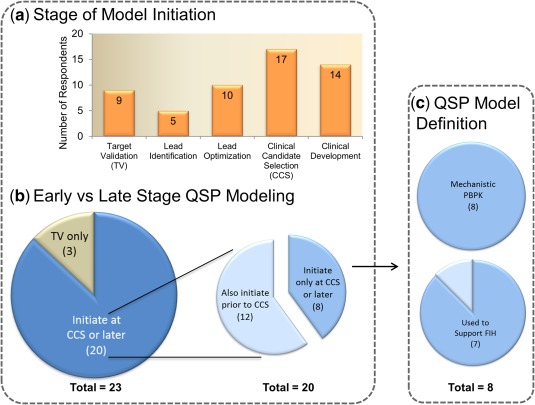
Quantitative systems pharmacology (QSP) model initiation by stage of drug discovery/development. (a) The QSP models are being implemented across all stages of drug discovery/development. (b) Three companies are implementing QSP modeling at the target validation stage only, whereas 20 initiate at clinical candidate selection (CCS) or later. Of those 20, 60% also have activities prior to CCS. Those who only initiated QSP at CCS or later were examined further to understand the role of PBPK and FIH support. (c) In these cases, all considered mechanistic physiologically based pharmacokinetic (PBPK) as a type of QSP model, suggesting that QSP may be used in clinical dose prediction or related pharmacokinetic questions. This hypothesis may be strengthened by the fact that seven of the eight responders also sited that QSP modeling was used to support first‐in‐human (FIH) studies.

Quantitative systems pharmacology (QSP) model scope, size, and development time. (a) No companies are solely using platform models. (b) Model size/complexity was assessed based on the number of model variables. Fit‐for‐purpose models (orange bars) tend to be smaller in size compared with models being developed by companies implementing fit‐for‐purpose and platform models (red bars). (c) Model development time is evenly distributed for fit‐for‐purpose models, whereas responders who are working on both types of models have a greater emphasis on longer development timelines.
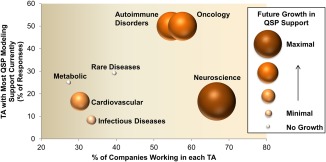
Current and future impact of quantitative systems pharmacology (QSP) across therapeutic areas (TAs). As indicated by the horizontal positioning of the circles, neuroscience, oncology, and autoimmune disorders are the three TAs with the most investment across responding companies. Oncology and autoimmune disorders have a greatest current support by QSP activities (vertical position), whereas neuroscience is similar to other TAs. However, neuroscience is expected to have the most growth in QSP modeling support in the next 5 years (size and color of circle), followed by continued investments in oncology and autoimmune disorders.
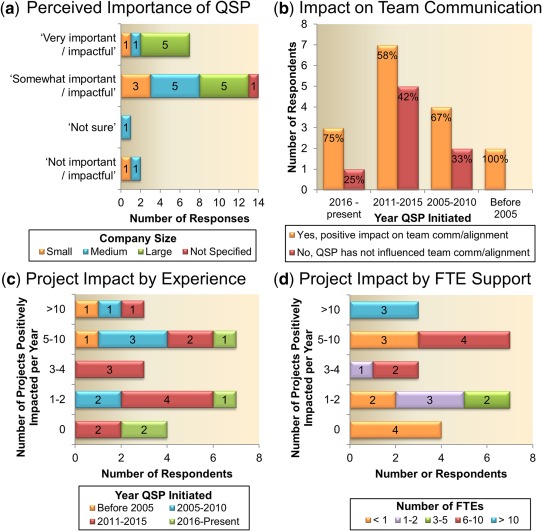
Preclinical quantitative systems pharmacology (QSP) impact. (a) The majority of surveyed companies see that preclinical QSP is important/impactful, although nearly 60% selected it as being only somewhat impactful. Small = <2,000 employees, medium = 2,000–10,000; and large = >10,000 employees. (b) Two‐thirds of respondents indicated that QSP modeling had a positive impact on team communication/alignment. The bottom panels show the number of projects positively impacted per year segmented by (c) the year QSP was initiated and (d) number of full time equivalent (FTE) employees assigned to QSP within the company.
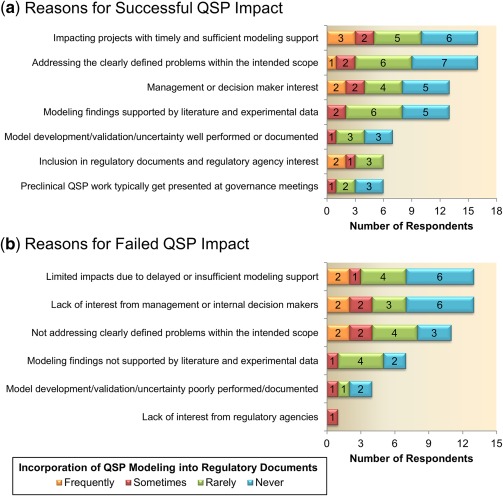
Reasons for successful (a) or failed (b) quantitative systems pharmacology (QSP) impact. Responses are listed vertically in descending order from most cited to least cited and are further segmented by the frequency with which QSP work makes it into regulatory submission documents.
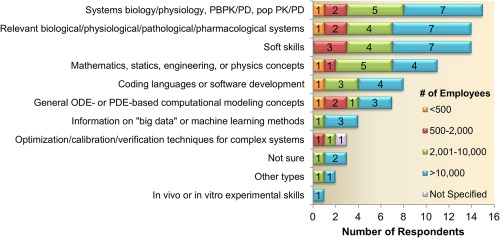
Cross‐functional training opportunities for modelers. Responses are segmented by company size. Most companies indicate a need for technical training related to comprehensive and mathematical model building, as well as the need to develop soft skills (like communication, leadership, and project management). ODE, ordinary differential equation; PBPK, physiologically based pharmacokinetic; PD, pharmacodynamic; PDE, partial differential equation; popPK/PD, population pharmacokinetic/pharmacodynamic; QSP, quantitative systems pharmacology.
References
-
- DiMasi, J.A. , Grabowski, H.G. & Hansen, R.W. Innovation in the pharmaceutical industry: new estimates of R&D costs. J. Health Econ. 47, 20–33 (2016). - PubMed
-
- Scannell, J.W. , Blanckley, A. , Boldon, H. & Warrington, B. Diagnosing the decline in pharmaceutical R&D efficiency. Nat. Rev. Drug Discov. 11, 191–200 (2012). - PubMed
-
- Arrowsmith, J. & Miller, P. Trial watch: phase II and phase III attrition rates 2011–2012. Nat. Rev. Drug Discov. 12, 569 (2013). - PubMed
-
- Smietana, K. , Siatkowski, M. & Møller, M. Trends in clinical success rates. Nat. Rev. Drug Discov. 15, 379–380 (2016). - PubMed
-
- U.S. Department of Health and Human Services . Food and Drug Administration. Innovation or Stagnation: Challenge and opportunity on the critical path to new medical products. Washington, DC. <https://www.fda.gov/downloads/ScienceResearch/SpecialTopics/CriticalPath...> (2004).
Publication types
MeSH terms
LinkOut - more resources
Full Text Sources
Other Literature Sources
Miscellaneous
